Mathematics - Leaving Certificate Examination - Sample Paper - 2012 Page 10
ADVERTISEMENT
 1
1 2
2 3
3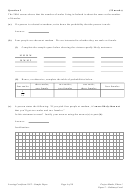 4
4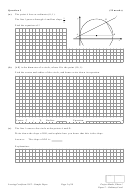 5
5 6
6 7
7 8
8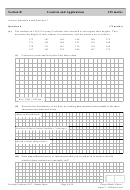 9
9 10
10 11
11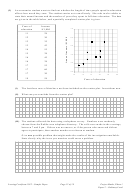 12
12 13
13 14
14 15
15 16
16 17
17 18
18 19
19 20
20(b)
The students decide to look at the heights of the males and the females in the class separately.
The heights are given below:
Males
Females
173
180
174
167
161
160
175
178
176
157
164
172
180
171
170
168
149
161
187
176
166
167
167
171
(i)
Construct a back-to-back stem and leaf plot of the above data.
(ii)
State one difference and one similarity between the two distributions.
Difference:
Similarity:
Leaving Certificate 2012 – Sample Paper
Page 10 of 19
Project Maths, Phase 1
Paper 2 – Ordinary Level
ADVERTISEMENT
0 votes
Related Articles
Related forms


Related Categories
Parent category: Education