Mathematics - Leaving Certificate Examination - Sample Paper - 2012 Page 12
ADVERTISEMENT
 1
1 2
2 3
3 4
4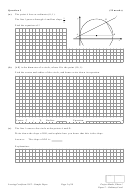 5
5 6
6 7
7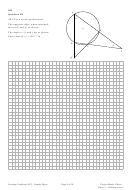 8
8 9
9 10
10 11
11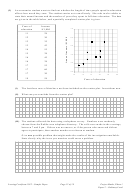 12
12 13
13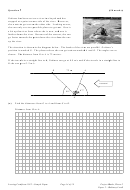 14
14 15
15 16
16 17
17 18
18 19
19 20
20(f)
An economics student wants to find out whether the length of time people spend in education
affects how much they earn. The student carries out a small study. She asks twelve adults to
state their annual income and the number of years they spent in full-time education. The data
are given in the table below, and a partially completed scatter plot is given.
Years of
Income
70
education
/€1,000
11
28
12
30
60
13
35
13
43
50
14
55
15
38
40
16
45
16
38
30
17
55
17
60
20
17
30
10
12
14
16
18
20
19
58
Years of education
(i)
The last three rows of data have not been included on the scatter plot. Insert them now.
(ii)
What can you conclude from the scatter plot?
(iii) The student collected the data using a telephone survey. Numbers were randomly
chosen from the Dublin area telephone directory. The calls were made in the evenings,
between 7 and 9 pm. If there was no answer, or if the person who answered did not
agree to participate, then another number was chosen at random.
Give one possible problem that might make the results of the investigation unreliable.
State clearly why the issue you mention could cause a problem.
Leaving Certificate 2012 – Sample Paper
Page 12 of 19
Project Maths, Phase 1
Paper 2 – Ordinary Level
ADVERTISEMENT
0 votes
Related Articles
Related forms


Related Categories
Parent category: Education