Mathematics - Leaving Certificate Examination - Sample Paper - 2012 Page 9
ADVERTISEMENT
 1
1 2
2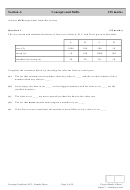 3
3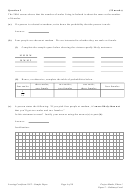 4
4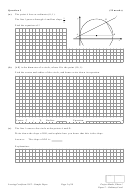 5
5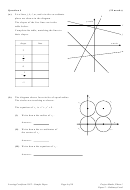 6
6 7
7 8
8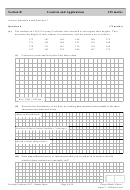 9
9 10
10 11
11 12
12 13
13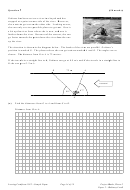 14
14 15
15 16
16 17
17 18
18 19
19 20
20Section B
Contexts and Applications
125 marks
Answer Question 6 and Question 7.
Question 6
(75 marks)
(a)
The students in a 2012 Leaving Certificate class decided to investigate their heights. They
measured the height of each student, in centimetres, and the results were as follows:
173
167
180
168
180
175
171
161
164
187
176
160
170
171
167
178
174
149
157
161
176
166
167
172
(i)
Construct a stem and leaf plot of the above data.
Key: 14|9 = 149 cm
(ii)
Describe the distribution of the data, by making one statement about each of the three
characteristics indicated below.
shape of distribution:
location of data (central tendency / average):
spread of data (dispersion):
(iii) State one additional piece of information that you would need in order to decide
whether these students are unusually tall?
page
running
Leaving Certificate 2012 – Sample Paper
Page 9 of 19
Project Maths, Phase 1
Paper 2 – Ordinary Level
ADVERTISEMENT
0 votes
Related Articles
Related forms


Related Categories
Parent category: Education