Life Cycle Cost & Reliability For Process Equipment Page 11
ADVERTISEMENT
 1
1 2
2 3
3 4
4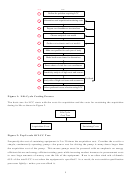 5
5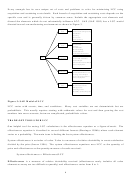 6
6 7
7 8
8 9
9 10
10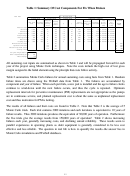 11
11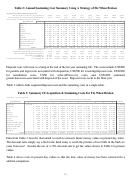 12
12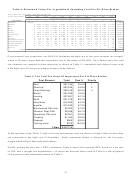 13
13 14
14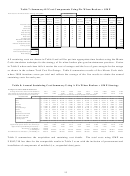 15
15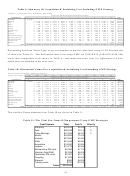 16
16 17
17 18
18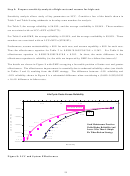 19
19 20
20 21
21 22
22Table 1: Summary Of Cost Components For Fix When Broken
Raw Data
Weibull Data
Costs Per Incident
Variable Data
Variable Data
Variable Data
Elapsed
Lost
Total Cost
Annual
Activity
Replaced
Item Cost
Logistics
Repair or
Maint.
Logistics
Gross
Per
β
η
Cost
Part Cost
Costs
US$
Cost US$
Activity
L&E US$
Costs US$
Margin
Outage
US$/hr
US$
US$
hours
US$
US$
Electrical costs=
--
--
--
--
--
--
--
--
--
--
--
$
16,500
Seal cost=
$
2,500
$
75
8
100
1.4
4.5
800
$
2,500
$
75
$
80,000
$
83,375
Shaft cost=
$
3,500
$
300
10
100
1.2
22
1,000
$
3,500
$
300
$
100,000
$
104,800
Impeller cost=
$
3,500
$
300
8
100
2.5
16
800
$
3,500
$
300
$
80,000
$
84,600
Pump housing=
$
4,500
$
1,000
14
100
1.3
22
1,400
$
4,500
$
1,000
$
140,000
$
146,900
Bearings cost=
$
400
$
75
8
100
1.3
6
800
$
400
$
75
$
80,000
$
81,275
Motor cost=
$
3,000
$
500
8
100
1.2
12
800
$
3,000
$
500
$
80,000
$
84,300
Coupling cost=
$
1,200
$
300
8
100
2
20
800
$
1,200
$
300
$
80,000
$
82,300
Maintenance PM costs=
12
50
$
600
Operations PM costs=
10.4
35
$
364
10.4
50
$
520
Vibration Dept PdM costs=
0.5
255
$
128
Training costs=
$
18,112
Lost gross margin US$/hr =
$
10,000
Power cost(US$165/hp-yr)=
$
165
Motor size(hp)=
100
All sustaining cost inputs are summarized as shown in Table 1 and will be propagated forward for each
year of the project using Monte Carlo techniques. Note the costs include the high cost of lost gross
margin assigned to the failed element using the principle that costs follow activity.
Table 2 summarizes Monte Carlo failures for annual sustaining costs using facts from Table 1. Random
failure times are drawn using the Weibull data from Table 1. The failures are accumulated by
component and year of failure. When each part fails, a new part is installed and the age to failure clocks
continue to wind-down until the next failure occurs, and thus the cycle is repeated. Optimum
replacement intervals for preventive maintenance (PM) replacements are not appropriate as the pumps
are in continuous service, and planned replacement cost is about the same as unplanned replacement
cost and thus motivation for PM is lacking.
The results of all failures and their costs are found in Table 2. Note that Table 2 is the average of 5
Monte Carlo trials. Each trial contains 3000 iterations and each iterations is equivalent to 10 years of
failure results. Thus 3000 iterations produces the equivalent of 30,000 years of operation. Furthermore
the five trials give the average results from 150,000 years of operation! Table 2 shows increasing
failures each year, generally increasing costs, and declining annual reliability. These results seem to
parallel experiences in operating plants as older equipment is generally considered to be less cost
effective and less reliable. The question in real life is how to quantify the results--the answer lies in
Monte Carlo simulations and Weibull databases.
11
ADVERTISEMENT
0 votes
Related Articles
Related forms


Related Categories
Parent category: Business