Life Cycle Cost & Reliability For Process Equipment Page 15
ADVERTISEMENT
 1
1 2
2 3
3 4
4 5
5 6
6 7
7 8
8 9
9 10
10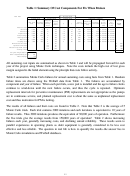 11
11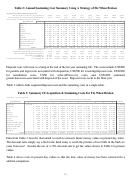 12
12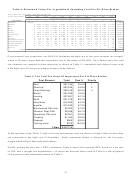 13
13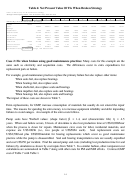 14
14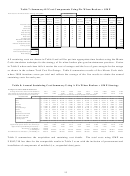 15
15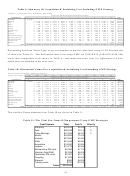 16
16 17
17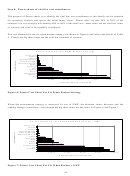 18
18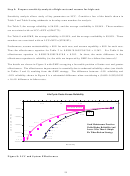 19
19 20
20 21
21 22
22Table 7: Summary Of Cost Components Using Fix When Broken + GMP
Raw Data For Fix When Broken Strategy Using GMP
Weibull Data
Costs Per Incident
Variable Data
Variable Data
Variable Data
Elapsed
Annual
Activity
Replaced
Logistics
Total Cost
Item Cost
Logistics
Repair or
Maint.
Lost Gross
β
η
Cost
Part Cost
Costs
Per Outage
Costs
US$
Cost US$
Activity
L&E US$
Margin US$
US$/hr
US$
US$
US$
US$
hours
Electrical costs=
--
--
--
--
--
--
--
--
--
--
--
$
16,500
Seal cost=
$
2,500
$
75
8
100
1.4
4.5
800
$
2,900
$
150
$
80,000
$
83,850
Shaft cost=
$
3,500
$
300
10
100
1.2
22
1,000
$
6,400
$
450
$
100,000
$
107,850
Impeller cost=
$
3,500
$
300
8
100
2.5
16
800
$
6,400
$
450
$
80,000
$
87,650
Pump housing=
$
4,500
$
1,000
14
100
1.3
22
1,400
$
7,400
$
1,150
$
140,000
$
149,950
Bearings cost=
$
400
$
75
8
100
1.3
6
800
$
2,900
$
150
$
80,000
$
83,850
Motor cost=
$
3,000
$
500
8
100
1.2
12
800
$
3,000
$
500
$
80,000
$
84,300
Coupling cost=
$
1,200
$
300
8
100
2
20
800
$
1,200
$
300
$
80,000
$
82,300
Maintenance PM costs=
12
50
$
600
Operations PM costs=
10.4
35
$
364
Vibration Dept PdM costs=
10.4
50
$
520
Training costs=
0.5
255
$
128
$
18,112
Lost gross margin US$/hr =
$
10,000
Power cost(US$165/hp-yr)=
$
165
Motor size(hp)=
100
All sustaining costs are shown in Table 8 and will be put into appropriate time buckets using the Monte
Carlo simulation technique for the strategy of fix when broken plus good maintenance practices. Notice
in Table 8 when each item fails it carries the cost of outages and the loss of gross margin for the outage
as shown in the column Total Cost Per Outage. Table 8 summarizes results of five Monte Carlo trials
where 3000 iterations occur per trial and reflects the average of the five results to obtain the annual
sustaining costs for each year.
Table 8: Annual Sustaining Cost Summary Using A Fix When Broken + GMP Strategy
Average of 5 trials at 3000 iterations/trial:
Average Down Time Hours For All Iterations=
2.611
3.743
4.193
4.398
4.567
4.677
4.819
4.989
4.959
5.094
Average Number Of Failures/year For All Iterations=
0.307
0.440
0.492
0.515
0.535
0.548
0.563
0.582
0.579
0.593
Annual Cost Expected For Each Time Interval
Project Year And Annual Costs Expected From Simulation
Cost Element
0
1
2
3
4
5
6
7
8
9
10
Electricity
$
16,500
$
16,500
$
16,500
$
16,500
$
16,500
$
16,500
$
16,500
$
16,500
$
16,500
$
16,500
Seal
$
9,749
$
14,909
$
16,513
$
16,507
$
16,641
$
16,200
$
16,239
$
16,144
$
16,261
$
15,898
Shaft
$
2,739
$
3,351
$
3,825
$
3,688
$
3,990
$
4,019
$
4,458
$
4,681
$
4,422
$
4,558
Impeller
$
129
$
456
$
812
$
1,385
$
1,987
$
2,799
$
3,307
$
4,125
$
4,242
$
5,031
Housing
$
2,699
$
3,969
$
4,618
$
5,218
$
5,398
$
5,418
$
5,868
$
6,258
$
6,168
$
6,578
Pump Bearings
$
7,832
$
10,587
$
11,269
$
11,588
$
11,834
$
12,130
$
11,784
$
11,532
$
11,398
$
11,845
Motors
$
4,187
$
5,553
$
6,008
$
6,497
$
6,525
$
6,643
$
6,693
$
7,188
$
7,008
$
6,800
Coupling
$
199
$
227
$
262
$
284
$
304
$
327
$
352
$
369
$
375
$
391
Maintenance PM visits
$
600
$
600
$
600
$
600
$
600
$
600
$
600
$
600
$
600
$
600
Operations PM visits
$
364
$
364
$
364
$
364
$
364
$
364
$
364
$
364
$
364
$
364
Vibration Dept PdM
$
520
$
520
$
520
$
520
$
520
$
520
$
520
$
520
$
520
$
520
Training costs
$
128
$
128
$
128
$
128
$
128
$
128
$
128
$
128
$
128
$
128
Total=
$
45,645
$
57,162
$
61,419
$
63,279
$
64,792
$
65,648
$
66,813
$
68,408
$
67,986
$
69,214
Approximate suspensions per failure=
0
0
0
0
0
0
0
0
0
0
Approximate system failure rate (failures/yr)=
0.307
0.440
0.492
0.515
0.535
0.548
0.563
0.582
0.579
0.593
Approximate system MTBF(years/failure) =
3.265
2.272
2.033
1.942
1.871
1.825
1.778
1.720
1.729
1.685
Theoretical 1 yr Reliability =
72.92%
1 yr reliability, R=
73.60%
64.39%
61.13%
59.75%
58.59%
57.80%
56.97%
55.91%
56.06%
55.25%
Good Maintenance Practices 1 yr Availability, A=
99.97%
99.96%
99.95%
99.95%
99.95%
99.95%
99.94%
99.94%
99.94%
99.94%
Table 9 summarizes the acquisition and sustaining cost details. The total costs using GMP are
US$42,740 less than for the comparable results in Table 3 even with the inclusion of procurement and
installation of components of unfailed (i.e., suspended data) parts.
15
ADVERTISEMENT
0 votes
Related Articles
Related forms


Related Categories
Parent category: Business