Life Cycle Cost & Reliability For Process Equipment Page 19
ADVERTISEMENT
 1
1 2
2 3
3 4
4 5
5 6
6 7
7 8
8 9
9 10
10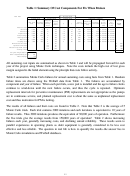 11
11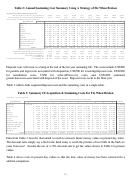 12
12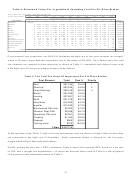 13
13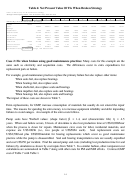 14
14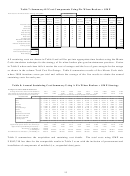 15
15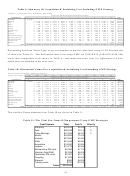 16
16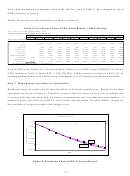 17
17 18
18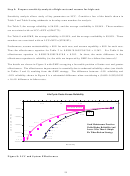 19
19 20
20 21
21 22
22Step 9: Prepare sensitivity analysis of high costs and reasons for high cost.
Sensitivity analysis allows study of key parameters on LCC. Consider a few of the details shown in
Table 2 and Table 8 using arithmetic to develop some numbers for analysis.
For Table 2, the average reliability is 56.59%, and the average availability is 99.94%. These numbers
are associated with an LCC=NPV=($240773).
For Table 8 with GMP, the average reliability is 59.95%, and the average availability is 99.95%. These
numbers are associated with an LCC=NPV=($228592).
Furthermore, assume maintainability = 80% for each case, and assume capability = 80% for each case.
Thus the effectiveness equation for Table 2 is: 0.9994*0.5659*0.8*0.8 = 0.362.
For Table 8 the
effectiveness equation is: 0.9995*0.5995*0.8*0.8 = 0.383. In short, the main difference in the
effectiveness equations is reliability (i.e, the odds are improved by GMP for a failure free interval)!
The details are shown in Figure 8 with GMP occupying a favorable position of better cost and greater
effectiveness. The effectiveness improvement is essentially due to enhanced reliability values (see details
in Tables 2 and 8) resulting from the GMP strategy. The difference between ~55% reliability and
~50% reliability shown in Figure 8 is a substantial difference when considering a (0.690 -0.593)/0.593
= 16.4% difference in failure rates.
Life Cycle Costs Versus Reliability
0
0.5
0.55
0.6
0.65
0.7
0.75
Fix When Broken
-50000
Yr= 1
GMP
Yr= 2
Yr= 3
-100000
Yr= 3
Yr= 4
Yr= 4
Yr= 5
Good Maintenance Practices
Yr= 5
-150000
Yr= 6
Yields Higher Reliability And
Yr= 6
Lower Costs Than A Simple
Yr= 7
Yr= 7
Fix When Broken Strategy
-200000
Yr= 8
Yr= 8
Yr= 9
Yr= 9
Yr= 10
Yr= 10
-250000
Reliability
Figure 8: LCC and System Effectiveness
19
ADVERTISEMENT
0 votes
Related Articles
Related forms


Related Categories
Parent category: Business