Life Cycle Cost & Reliability For Process Equipment Page 17
ADVERTISEMENT
 1
1 2
2 3
3 4
4 5
5 6
6 7
7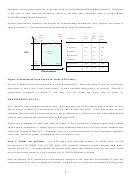 8
8 9
9 10
10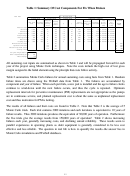 11
11 12
12 13
13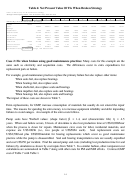 14
14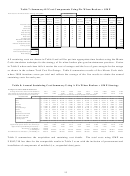 15
15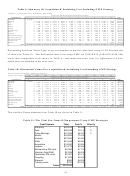 16
16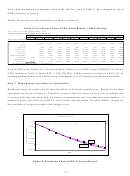 17
17 18
18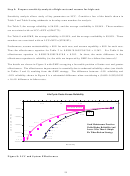 19
19 20
20 21
21 22
22Notice how the ranking and absolute values of the vital few items in Table 11 have changed by use of
GMP compared to Table 5.
Finally, the net present value calculations are shown in Table 12.
Table 12: Net Present Value Of Fix When Broken + GMP Strategy
NPV For API Pump--Fix When Broken Strategy + GMP
Straight line depreciation, 12% discount rate, 38% tax rate
Year
0
1
2
3
4
5
6
7
8
9
10
API Pump--Fix When Broken Strategy + GMP
Capital
18000
Cost
$
45,645
$
57,162
$
61,419
$
63,279
$
64,792
$
65,648
$
66,813
$
68,408
$
67,986
$
72,214
Savings
Depreciation
1800
1800
1800
1800
1800
1800
1800
1800
1800
1800
Profit b/4 taxes
-47445
-58962
-63219
-65079
-66592
-67448
-68613
-70208
-69786
-74014
Tax Provision
18029
22406
24023
24730
25305
25630
26073
26679
26519
28125
Net Income
-29416
-36557
-39196
-40349
-41287
-41818
-42540
-43529
-43268
-45888
Add Back Depreciation
1800
1800
1800
1800
1800
1800
1800
1800
1800
1800
Cash Flow
-18000
-27616
-34757
-37396
-38549
-39487
-40018
-40740
-41729
-41468
-44088
Discount Factors
1.00
1.12
1.25
1.40
1.57
1.76
1.97
2.21
2.48
2.77
3.11
Present Value
-18000
-24657
-27708
-26618
-24499
-22406
-20274
-18429
-16854
-14954
-14195
Net Present Value
$
(228,592)
using a 12% discount rate
Note the NPV from Table 6 for a fix when broken (without use of GMP) shows US$(240,773) and the
GMP strategy in Table 12 shows NPV = US$(228,592). GMP produces a savings of US$12,181 by
avoiding pending failures even with inclusion of the higher costs of replacing parts that have not failed.
Step 7: Make break-even charts for alternatives.
Breakeven charts are useful tools for showing effects of fixed and variable costs. Results for the three
alternatives are shown in Figure 5. Cumulative present values are shown on the y-axis to combine cost
of money with time and show how the effects of expenditures and cost reductions play together. A
breakeven points does not exist as GMP is always better than the simple “fix when broken” strategy for
this condition of lost gross margins when outages occur.
Breakeven Chart
0
0
1
2
3
4
5
6
7
8
9
10
-50000
-100000
-150000
GMP
-200000
w/o GMP
-250000
Time
Figure 5: Breakeven Chart (GMP Is Always Better!)
17
ADVERTISEMENT
0 votes
Related Articles
Related forms


Related Categories
Parent category: Business