Use A Bar Graph - Math Worksheet With Answers
ADVERTISEMENT
 1
1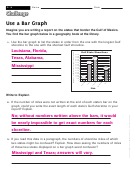 2
23–16
Name
Date
Use a Bar Graph
Imagine you are writing a report on the states that border the Gulf of Mexico.
You find the bar graph below in a geography book at the library.
Use the bar graph to list the states in order from the one with the longest Gulf
1.
shoreline to the one with the shortest Gulf shoreline.
Gulf State Shorelines
8,000
7,500
7,721
7,000
mi
6,500
6,000
5,095
5,500
mi
5,000
4,500
3,359
4,000
mi
3,500
3,000
2,500
2,000
1,500
607
359
1,000
mi
mi
500
0
State
Write to Explain
If the number of miles were not written at the end of each state’s bar on the
2.
graph, could you write the exact length of each state’s Gulf shoreline in your
report? Explain.
If you read this data in a paragraph, the numbers of shoreline miles of which
3.
two states might be confused? Explain. How does seeing the numbers of miles
of those two states displayed on a bar graph avoid confusion?
ADVERTISEMENT
0 votes
Related Articles
Related forms


 - Math Worksheet With Answers")
Related Categories
Parent category: Education