Form It-Qj - Georgia Department Of Revenue Application For Georgia Quality Jobs Tax Credit Page 6
Download a blank fillable Form It-Qj - Georgia Department Of Revenue Application For Georgia Quality Jobs Tax Credit in PDF format just by clicking the "DOWNLOAD PDF" button.
Open the file in any PDF-viewing software. Adobe Reader or any alternative for Windows or MacOS are required to access and complete fillable content.
Complete Form It-Qj - Georgia Department Of Revenue Application For Georgia Quality Jobs Tax Credit with your personal data - all interactive fields are highlighted in places where you should type, access drop-down lists or select multiple-choice options.
Some fillable PDF-files have the option of saving the completed form that contains your own data for later use or sending it out straight away.
ADVERTISEMENT
 1
1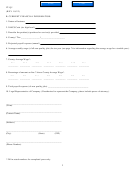 2
2 3
3 4
4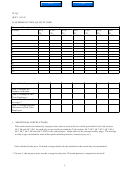 5
5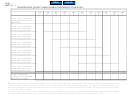 6
6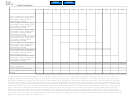 7
7 8
8PRINT
CLEAR
IT-QJ
(REV 10
)
TRACKING NEW QUALITY JOBS ELIGIBLE FOR CREDIT/5 YEAR RULE**
Year
Year
Year
Year
Year
Year
Year
Year
Year
Year
Year
1
2
3
4
5
6
7
8
9
10
11
Line 1: Year 1 average new
quality jobs
(from Line 5 in the
above chart)
Line 2: Year 2 average new
quality jobs increase (from
Line 5 in the above chart)
Line 3: Year 3 average new
quality jobs increase (from
Line 5 in the above chart)
Line 4: Year 4 average new
quality jobs increase (from
Line 5 in the above chart)
Line 5: Year 5 average new
quality jobs increase (from
Line 5 in the above chart)
Line 6: Year 6 average new
quality jobs increase (from
Line 5 in the above chart)
Line 7: Year 7 average new
quality jobs increase (from
Line 5 in the above chart)
Line 8: Total number
(average) of new quality jobs
eligible for the credit *
*
The taxpayer must maintain the minimum number of new quality jobs in order to be eligible for the credit. Therefore, line 8 must be at least 50 in the
year(s) the credit is claimed. In the first taxable year in which the taxpayer first employs 50 new quality jobs, the taxpayer may claim the credit even if
the average number of new quality jobs is less than 50. In all subsequent years, the average number of new quality jobs must be at least 50 in a taxable
year in order to claim the credit.
** Credit for each new quality jobs may be claimed in the first year that the taxpayer creates the new quality job and to the extent the job is maintained
in Georgia, for the following four years. Therefore, in this chart the taxpayer is tracking the average new quality jobs for 5 years.
ADVERTISEMENT
0 votes
Related Articles
Related forms
 Form F-1193 - Florida Department Of Revenue Application For Florida Renewable Energy Production Credit Allocation
Financial
Form F-1193 - Florida Department Of Revenue Application For Florida Renewable Energy Production Credit Allocation
Financial

 Form Ur-j - Application For Eligibility - Urban Job Tax Credit Program - Florida Department Of Economic Opportunity
Legal
Form Ur-j - Application For Eligibility - Urban Job Tax Credit Program - Florida Department Of Economic Opportunity
Legal


Related Categories
Parent category: Financial