Edexcel Gcse Mathematics (Linear) - Scattergraphs Page 2
ADVERTISEMENT
 - Scattergraphs Printable pdf") 1
1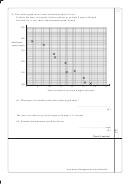 2
2 3
3 4
4 5
5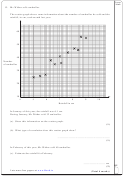 6
6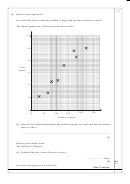 7
7 8
8Leave
blank
1. The scatter graph shows some information about 10 cars.
It shows the time, in seconds, it takes each car to go from 0 mph to 60 mph.
For each car, it also shows the maximum speed, in mph.
150
140
Maximum
speed (mph)
130
120
110
100
8
9
10
11
12
13
14
15
Time (seconds) to go from 0 mph to 60 mph
(a) What type of correlation does this scatter graph show?
..................................................
(1)
The time a car takes to go from 0 mph to 60 mph is 11 seconds.
(b) Estimate the maximum speed for this car.
........................................ mph
Q1
(2)
(Total 3 marks)
Lots more free papers at
ADVERTISEMENT
0 votes
Related Articles
Related forms
 - Surds")
 - Spheres And Cones")
 - Solvng Simultaneous Equations Graphically")
 - Simultaneous Equations With A Quadratic")
 - Simultaneous Equations")
 - Sine And Cosine Rules & Area Of Triangles")
 - Solving Quadratics By Factorising")
 - Fractions")
 - Compound Interest And Depreciation")
 - Angles")
Related Categories
Parent category: Education