Edexcel Gcse Mathematics (Linear) - Scattergraphs Page 6
ADVERTISEMENT
 - Scattergraphs Printable pdf") 1
1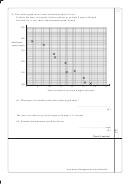 2
2 3
3 4
4 5
5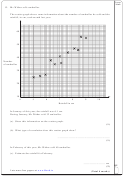 6
6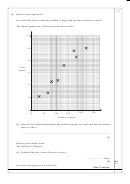 7
7 8
8Leave
blank
5. Mr Wither sells umbrellas.
The scatter graph shows some information about the number of umbrellas he sold and the
rainfall, in cm, each month last year.
60
50
40
Number
of umbrellas
30
20
10
4
5
6
7
8
9
10
Rainfall in cm
In January of this year, the rainfall was 6.1 cm.
During January, Mr Wither sold 32 umbrellas.
(a) Show this information on the scatter graph.
(1)
(b) What type of correlation does this scatter graph show?
...........................................................................
(1)
In February of this year, Mr Wither sold 40 umbrellas.
(c) Estimate the rainfall for February.
............................... cm
Q5
(2)
Lots more free papers at
(Total 4 marks)
ADVERTISEMENT
0 votes
Related Articles
Related forms
 - Surds")
 - Spheres And Cones")
 - Solvng Simultaneous Equations Graphically")
 - Simultaneous Equations With A Quadratic")
 - Simultaneous Equations")
 - Sine And Cosine Rules & Area Of Triangles")
 - Solving Quadratics By Factorising")
 - Fractions")
 - Compound Interest And Depreciation")
 - Angles")
Related Categories
Parent category: Education