Edexcel Gcse Mathematics (Linear) - Scattergraphs Page 3
ADVERTISEMENT
 - Scattergraphs Printable pdf") 1
1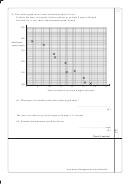 2
2 3
3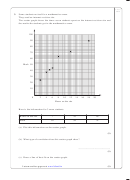 4
4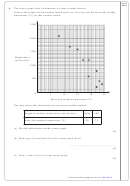 5
5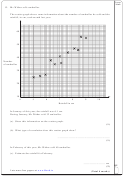 6
6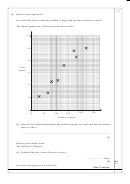 7
7 8
8Leave
blank
2. The scatter graph shows information about eight sheep.
It shows the height and the length of each sheep.
130
120
Length (cm)
110
100
90
80
70
50
55
60
65
70
75
80
85
Height (cm)
The table gives the height and the length of two more sheep.
Height (cm)
65
80
Length (cm)
100
110
(a) On the scatter graph, plot the information from the table.
(1)
(b) Describe the relationship between the height and the length of these sheep.
.......................................................................................................................................
(1)
The height of a sheep is 76 cm.
(c) Estimate the length of this sheep.
................................cm
Q2
(2)
(Total 4 marks)
Lots more free papers at
ADVERTISEMENT
0 votes
Related Articles
Related forms
 - Surds")
 - Spheres And Cones")
 - Solvng Simultaneous Equations Graphically")
 - Simultaneous Equations With A Quadratic")
 - Simultaneous Equations")
 - Sine And Cosine Rules & Area Of Triangles")
 - Solving Quadratics By Factorising")
 - Fractions")
 - Compound Interest And Depreciation")
 - Angles")
Related Categories
Parent category: Education