Edexcel Gcse Mathematics (Linear) - Scattergraphs Page 5
ADVERTISEMENT
 - Scattergraphs Printable pdf") 1
1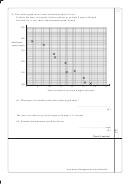 2
2 3
3 4
4 5
5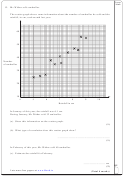 6
6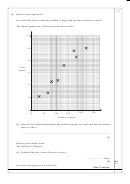 7
7 8
8Leave
blank
4. The scatter graph shows information for some weather stations.
It shows the height of each weather station above sea level (m) and the mean July midday
temperature (°C) for that weather station.
2500
2000
1500
Height above
sea level (m)
1000
500
O
5
10
15
20
25
Mean July midday temperature (°C)
The table shows this information for two more weather stations.
Height of weather station above sea level (m)
1000
500
Mean July midday temperature (°C)
20
22
(a) Plot this information on the scatter graph.
(1)
(b) What type of correlation does this scatter graph show?
................................................................
(1)
(c) Draw a line of best fit on the scatter graph.
(1)
Lots more free papers at
ADVERTISEMENT
0 votes
Related Articles
Related forms
 - Surds")
 - Spheres And Cones")
 - Solvng Simultaneous Equations Graphically")
 - Simultaneous Equations With A Quadratic")
 - Simultaneous Equations")
 - Sine And Cosine Rules & Area Of Triangles")
 - Solving Quadratics By Factorising")
 - Fractions")
 - Compound Interest And Depreciation")
 - Angles")
Related Categories
Parent category: Education