Data Handling Worksheet Page 19
ADVERTISEMENT
 1
1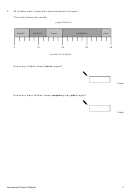 2
2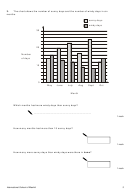 3
3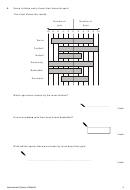 4
4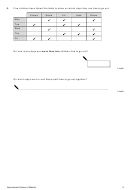 5
5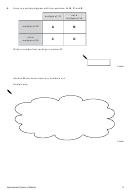 6
6 7
7 8
8 9
9 10
10 11
11 12
12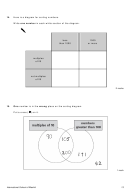 13
13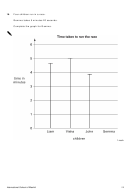 14
14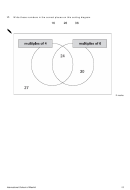 15
15 16
16 17
17 18
18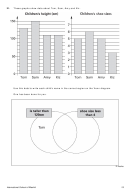 19
19 20
20 21
21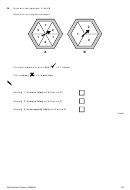 22
22 23
23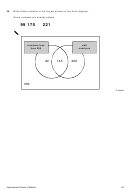 24
24 25
25 26
26 27
27 28
28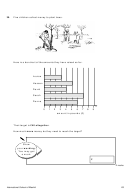 29
29 30
30 31
31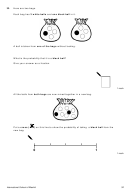 32
32 33
33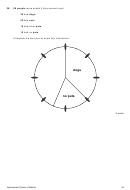 34
34 35
35 36
36 37
37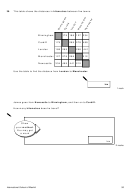 38
3821.
These graphs show data about Tom, Sam, Amy and Kiz.
Use this data to write each child’s name in the correct region on the Venn diagram.
One has been done for you.
2 marks
International School of Madrid
19
ADVERTISEMENT
0 votes
Related Articles
Related forms


Related Categories
Parent category: Business