Data Handling Worksheet Page 37
ADVERTISEMENT
 1
1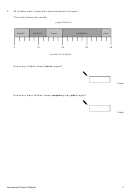 2
2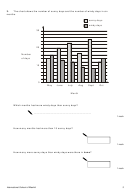 3
3 4
4 5
5 6
6 7
7 8
8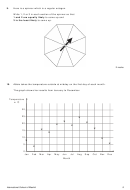 9
9 10
10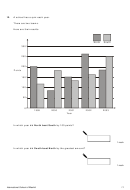 11
11 12
12 13
13 14
14 15
15 16
16 17
17 18
18 19
19 20
20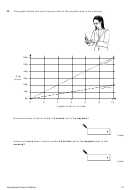 21
21 22
22 23
23 24
24 25
25 26
26 27
27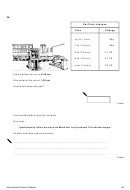 28
28 29
29 30
30 31
31 32
32 33
33 34
34 35
35 36
36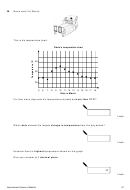 37
37 38
3838.
Gavin was ill in March.
This is his temperature chart.
Gavin's temperature chart
40
38
36
5
6
7
8
9 10 11 12 13 14 15 16 17 18
Date in March
For how many days was his temperature marked as more than 37°C?
1 mark
Which date showed the largest change in temperature from the day before?
1 mark
Estimate Gavin’s highest temperature shown on the graph.
Give your answer to 1 decimal place.
°C
1 mark
International School of Madrid
37
ADVERTISEMENT
0 votes
Related Articles
Related forms


Related Categories
Parent category: Business