Data Handling Worksheet Page 33
ADVERTISEMENT
 1
1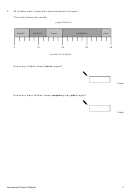 2
2 3
3 4
4 5
5 6
6 7
7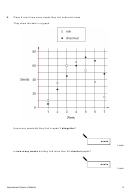 8
8 9
9 10
10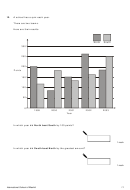 11
11 12
12 13
13 14
14 15
15 16
16 17
17 18
18 19
19 20
20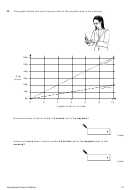 21
21 22
22 23
23 24
24 25
25 26
26 27
27 28
28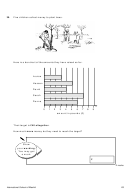 29
29 30
30 31
31 32
32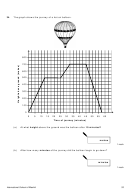 33
33 34
34 35
35 36
36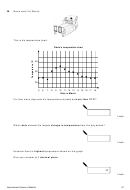 37
37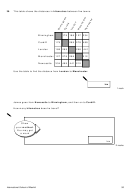 38
3834.
The graph shows the journey of a hot-air balloon.
800
700
600
500
400
300
200
100
0
0
5
10
15
20
25
30
35
40
45
50
55
60
Time of journey (minutes)
(a)
At what height above the ground was the balloon after 10 minutes?
metres
1 mark
(b)
After how many minutes of the journey did the balloon begin to go down?
minutes
1 mark
International School of Madrid
33
ADVERTISEMENT
0 votes
Related Articles
Related forms


Related Categories
Parent category: Business