Categorical Data Worksheet
ADVERTISEMENT
 1
1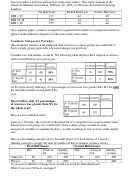 2
2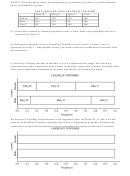 3
3Categorical Data
One-Way Frequency Table:
A study of accident records at a large engineering company in England (The
Lancet, October 22, 1994, page 1137) reported the following number in injuries
on each shift for 1 year:
Shift:
Morning
Afternoon
Night
Total
# of Injuries
1372
1578
1686
4636
What is the categorical variable?
What type of graph could you use to display this data?
What question could you attempt to answer using this data?
Two Way Frequency Table:
A four year study, reported in The New York Times, on men more than 70 years
old analyzed blood cholesterol levels and noted how many men with different
cholesterol levels suffered nonfatal or fatal heart attacks.
Low
Medium
High
Total
cholesterol
cholesterol
cholesterol
Nonfatal
29
17
18
64
heart attacks
Fatal heart
19
20
9
48
attacks
Total
48
37
27
112
What are the categorical variables?
What question(s) could you attempt to answer using this data?
In a two-way table, the marginal
60
70
50
40
distribution is the distribution of
30
60
20
10
50
0
each individual variable (using the
Low
Medium
High
40
totals of either the rows or the
30
20
columns). This can be displayed
10
0
in counts or relative frequencies
Nonfatal
Fatal
(percentages) for easier
comparison.
35
30
A segmented (or stacked) bar chart can be used to display the
25
Low
20
Medium
conditional distributions within each category. This is similar
15
High
10
5
to what a pie chart would show, with each bar a total of 100%.
0
Nonfatal
Fatal
35
100%
30
80%
25
60%
20
Nonfatal
Fatal
15
Fatal
Nonfatal
40%
10
20%
5
0
0%
Low
Medium
High
Low
Medium
High
100%
80%
High
60%
Medium
40%
Low
20%
0%
Nonfatal
Fatal
ADVERTISEMENT
0 votes
Related Articles
Related forms


Related Categories
Parent category: Business