Categorical Data Worksheet Page 3
ADVERTISEMENT
 1
1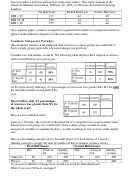 2
2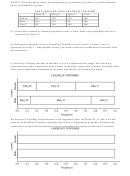 3
3AP FR 2. The table below shows the political party registration by gender of all 500 registered
voters in Franklin Township.
PARTY REGISTRATION–FRANKLIN TOWNSHIP
Party W
Party X
Party Y
Total
Female
60
120
120
300
Male
28
124
48
200
Total
88
244
168
500
(a) Given that a randomly selected registered voter is a male, what is the probability that he is
registered for Party Y?
(b) Among the registered voters of Franklin Township, are the events “is a male” and “is
registered for Party Y” independent? Justify your answer based on probabilities calculated from
the table above.
(c) One way to display the data in the table is to use a segmented bar graph. The following
segmented bar graph, constructed from the data in the party registration–Franklin Township table,
shows party-registration distributions for males and females in Franklin Township.
In Lawrence Township, the proportions of all registered voters for Parties W, X, and Y are the
same as for Franklin Township, and party registration is independent of gender. Complete the
graph below to show the distributions of party registration by gender in Lawrence Township.
ADVERTISEMENT
0 votes
Related Articles
Related forms


Related Categories
Parent category: Business