Categorical Data Worksheet Page 2
ADVERTISEMENT
 1
1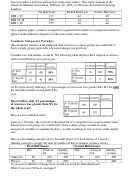 2
2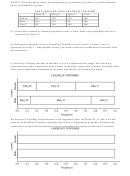 3
3Can we predict a hair loss pattern from body mass index? One study (Journal of the
American Medical Association, February 24, 1993) of 769 men showed the following
numbers:
No Hair Loss
Frontal Hair Loss
Vertex Hair Loss
BMI < 25
137
22
40
BMI 25-28
218
34
67
BMI > 28
153
30
68
On a separate paper, construct comparative segmented bar charts to compare the hair loss
pattern in the different categories of the men’s body mass index.
Caution: Simpson’s Paradox
One should be cautious with statistical data when two or more groups are combined to
form a single group, especially when percentages are involved.
Consider two individuals, A and B. The following table displays their respective success
ratios for both halves of a given year.
As the table clearly indicates, A’s percentages of successes was greater than B’s for both
the first half and the second half of the
year.
Does it follow that A’s percentages
of successes was greater than B’s for
the whole year?
Here are the combined totals:
Simpson’s Paradox: the reversal of the direction of a comparison or an association when
data from several groups are combined to form a single group; a result of using
categorical variables to separate the data – usually resulting in one or more small sample
size
Here are the batting averages of two baseball players for both halves of a season.
(Batting average is simply the ratio of number of hits to number of times at bat.)
First Half Season
Second Half Season
Hits
Times at
Batting
Hits
Times at
Batting
bat
average
bat
average
Caldwell
60
200
.300
50
200
.250
Wilson
29
100
.290
1
5
.200
If you were Caldwell’s manager how would you want the data displayed?
What if you were Wilson’s manager?
ADVERTISEMENT
0 votes
Related Articles
Related forms


Related Categories
Parent category: Business