Probability Explanation And Exercises Worksheet Page 13
ADVERTISEMENT
 1
1 2
2 3
3 4
4 5
5 6
6 7
7 8
8 9
9 10
10 11
11 12
12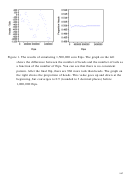 13
13 14
14 15
15 16
16 17
17 18
18 19
19 20
20 21
21 22
22 23
23 24
24 25
25 26
26 27
27 28
28 29
29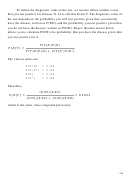 30
30 31
31 32
32 33
33 34
34 35
35 36
36 37
37Figure 1. The results of simulating 1,500,000 coin flips. The graph on the left
shows the difference between the number of heads and the number of tails as
a function of the number of flips. You can see that there is no consistent
pattern. After the final flip, there are 968 more tails than heads. The graph on
the right shows the proportion of heads. This value goes up and down at the
beginning, but converges to 0.5 (rounded to 3 decimal places) before
1,000,000 flips.
197
ADVERTISEMENT
0 votes
Related Articles
Related forms


Related Categories
Parent category: Education