9.1 Analyzing And Sketching Graphs Worksheet - Menlo Park City School District Page 2
ADVERTISEMENT
 1
1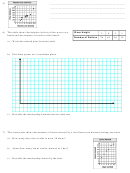 2
2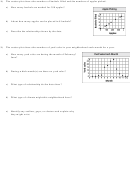 3
35)
_____________________________________________________
_____________________________________________________
_____________________________________________________
_____________________________________________________
6) The table shows the heights (in feet) of the waves at a
Wave Height
3
6
5
1
beach and the numbers of surfers at the beach.
Number of Surfers
24
61
56
15
a) Write the ordered pairs from the table
b) Plot these points on a coordinate plane.
c) Describe the relationship between the two data sets.
7) The scatter plot shows the numbers of lawns mowed by a local lawn care business during one week.
a) How many days does it take to mow 30 lawns?
b) About how many lawns can be mowed in 1 day?
c) Describe the relationship shown by the data.
ADVERTISEMENT
0 votes
Related Articles
Related forms


Related Categories
Parent category: Education