9.1 Analyzing And Sketching Graphs Worksheet - Menlo Park City School District Page 3
ADVERTISEMENT
 1
1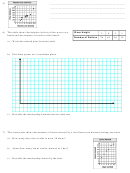 2
2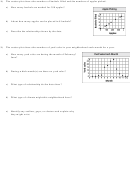 3
38) The scatter plot shows the numbers of bushels filled and the numbers of apples picked.
a) How many bushels are needed for 350 apples?
b) About how many apples can be placed in 8 bushels?
c) Describe the relationship shown by the data.
9) The scatter plot shows the numbers of yard sales in your neighborhood each month for a year.
a) How many yard sales are during the month of February?
June?
b) During which month(s) are there no yard sales?
c) What type of relationship do the data show?
d) What type of climate might this neighborhood have?
e) Identify any outliers, gaps, or clusters and explain why
they might exist.
ADVERTISEMENT
0 votes
Related Articles
Related forms


Related Categories
Parent category: Education