Lines Of Fit Scatter Plots Worksheet - Lesson 9.2 Menlo Park City School District
ADVERTISEMENT
 1
1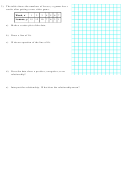 2
2Name: _________________________________________
Period: _____________
9.2
- Lines of Fit
1) The scatter plot shows the weights y of an infant
from birth through x months.
a) At what age did the infant weigh 11 pounds?
b) What was the infant’s weight at birth?
c) Draw a line that you think best approximates the points. (A line of
best fit).
d) Write an equation for your line.
e) Use the equation to predict the weight of the infant at 18 months.
f)
Does the data show a positive, a negative, or no relationship?
2) The scatter plot shows the relationship between the numbers of girls and
the numbers of boys in 10 different classrooms.
a) What type of relationship, if any, does the data show?
b) Is it possible to find the line of fit for the data? Explain.
c) Is it reasonable to use this scatter plot to predict the number of boys
in the classroom based on the number of girls? Explain.
ADVERTISEMENT
0 votes
Related Articles
Related forms


Related Categories
Parent category: Education