Aqa Gcse Math Worksheet - Pie Charts - Foundation Tier Page 11
ADVERTISEMENT
 1
1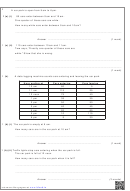 2
2 3
3 4
4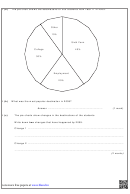 5
5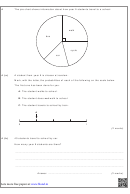 6
6 7
7 8
8 9
9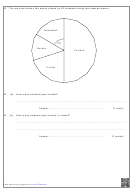 10
10 11
11 12
12 13
13 14
147 The pie chart shows how a council spends money on transport.
Only some of the percentages are given.
Other
(13%)
Concessionary
Community
fares
bus services
(12%)
Bus
Passes
Rail Passes
(35%)
7
(a) 25% of the money is spent on Concessionary fares.
Explain how the pie chart shows this.
.............................................................................................................................................
.............................................................................................................................................
(1 mark)
7
(b) What percentage of the money is spent on Bus Passes?
.............................................................................................................................................
.............................................................................................................................................
Answer .................................................................. %
(2 marks)
7
(c) The council spends £200 million on transport in total.
Work out 12% of £200 million to find how much the council spends on Community
bus services.
.............................................................................................................................................
.............................................................................................................................................
.............................................................................................................................................
.............................................................................................................................................
Answer £ ...................................................... million
(2 marks)
Lots more free papers at
ADVERTISEMENT
0 votes
Related Articles
Related forms


 With Answer Key - 2015")


Related Categories
Parent category: Education