Lines Of Fit Scatter Plots Worksheet - Lesson 9.2 Menlo Park City School District Page 2
ADVERTISEMENT
 1
1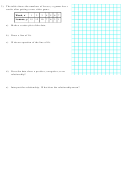 2
23) The table shows the numbers of losses y a gamer has x
weeks after getting a new video game.
Week, x
1
2
3
4 5 6 7
Losses, y
15 12 10 7 6 3 1
a) Make a scatter plot of the data.
b) Draw a line of fit.
c) Write an equation of the line of fit.
d) Does the data show a positive, a negative, or no
relationship?
e) Interpret the relationship. What does the relationship mean?
ADVERTISEMENT
0 votes
Related Articles
Related forms


Related Categories
Parent category: Education