Graphing Inequalities Worksheet - West Bridgford School Page 5
ADVERTISEMENT
 1
1 2
2 3
3 4
4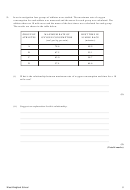 5
5 6
6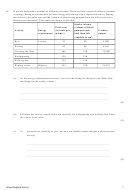 7
7 8
83.
In an investigation four groups of athletes were studied. The maximum rate of oxygen
consumption for each athlete was measured and the mean for each group was calculated. The
athletes then ran 10 mile races and the mean of the best times was calculated for each group.
The results are shown in the table below.
GROUP OF
MAXIMUM RATE OF
BEST TIME IN
ATHLETES
OXYGEN CONSUMPTION
10 MILE RACE
(cm³ per kg per min)
(minutes)
A
78.6
48.9
B
67.5
55.1
C
63.0
58.7
64.6
D
57.4
(i)
What is the relationship between maximum rate of oxygen consumption and time for a 10
mile race?
.....................................................................................................................................
.....................................................................................................................................
(1)
(ii)
Suggest an explanation for this relationship.
.....................................................................................................................................
.....................................................................................................................................
.....................................................................................................................................
.....................................................................................................................................
.....................................................................................................................................
.....................................................................................................................................
(3)
(Total 4 marks)
West Bridgford School
5
ADVERTISEMENT
0 votes
Related Articles
Related forms


 Worksheet With Answer Key")


Related Categories
Parent category: Education