Graphing Inequalities Worksheet - West Bridgford School Page 7
ADVERTISEMENT
 1
1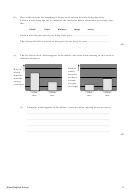 2
2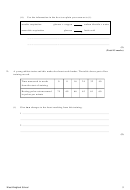 3
3 4
4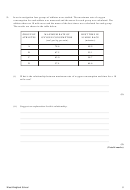 5
5 6
6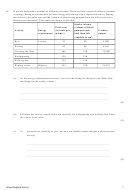 7
7 8
86.
A person undertook a number of different activities. These activities required different amounts
of energy. Being at rest required the least energy and rowing a boat required the most. During
the activities the pulse rate and the volume of blood being pumped from the left ventricle per
minute were measured. The results are shown in the table.
Stroke volume
Pulse rate
(volume of blood
Activity
Energy
(in beats per
pumped each
Cardiac
requirement
minute)
beat from left
output
3
ventricle in cm
)
Rest
Lowest
70
80
5 600
Writing
85
96
8 160
Cleaning the floor
100
120
12 000
Wallpapering
120
136
Walking fast
132
130
Rowing a boat
Highest
153
124
18 972
(a)
As the energy requirement increases, how does the change in the pulse rate differ from
the change in the stroke volume?
....................................................................................................................................
....................................................................................................................................
....................................................................................................................................
(1)
(b)
Calculate the cardiac output of the left ventricle for wallpapering and walking fast. Enter
the values in the table.
(1)
(c)
(i)
Describe, as carefully as you can, how the cardiac output changes with increasing
activity.
...........................................................................................................................
...........................................................................................................................
...........................................................................................................................
(2)
West Bridgford School
7
ADVERTISEMENT
0 votes
Related Articles
Related forms


 Worksheet With Answer Key")


Related Categories
Parent category: Education