Graphing Inequalities Worksheet - West Bridgford School Page 8
ADVERTISEMENT
 1
1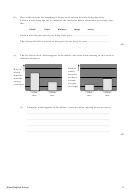 2
2 3
3 4
4 5
5 6
6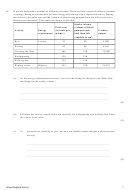 7
7 8
8(ii)
Explain the changes in cardiac output which occur as a person increases their
activity.
...........................................................................................................................
...........................................................................................................................
...........................................................................................................................
(2)
(Total 6 marks)
West Bridgford School
8
ADVERTISEMENT
0 votes
Related Articles
Related forms


 Worksheet With Answer Key")


Related Categories
Parent category: Education