Graphs, Linear Equations, And Inequalities In Two Variables, Functions Worksheet - Mat 100, Armstrong/pierson Page 10
ADVERTISEMENT
 1
1 2
2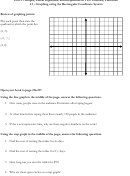 3
3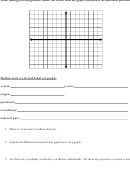 4
4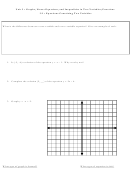 5
5 6
6 7
7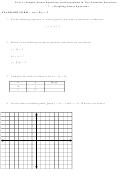 8
8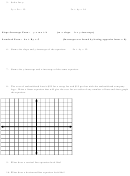 9
9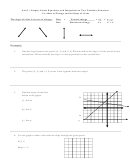 10
10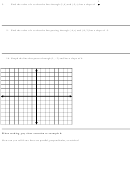 11
11 12
12 13
13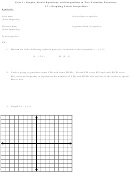 14
14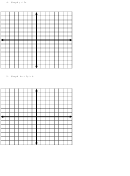 15
15 16
16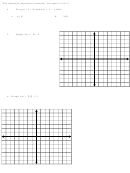 17
17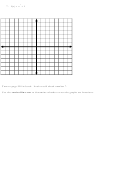 18
18Unit 3 – Graphs, Linear Equations, and Inequalities in Two Variables; Functions
3.4 – Rate of Change and the Slope of a Line
The slope of a line is its rate of change:
Rise
=
Vertical change
= ∆ y = y
– y
2
1
Run
Horizontal change
∆ x
x
– x
2
1
Examples:
1.
Find the slope between the points (4, -5) and (3, 2). What would be the slope of a line parallel to this
created line? What would be the slope of a line perpendicular to this created line?
2.
The points (5, -2) and (-5, 9) create a line segment with what slope?
3.
Find the slope of each line
shown in the graph.
N
(a) line m
(b) line n
m
(c) line p
p
8. Use the graph to draw a line with the slope through the given point:
K(3, 1)
Slope = -2
ADVERTISEMENT
0 votes
Related Articles
Related forms


Related Categories
Parent category: Education