Graphs, Linear Equations, And Inequalities In Two Variables, Functions Worksheet - Mat 100, Armstrong/pierson Page 6
ADVERTISEMENT
 1
1 2
2 3
3 4
4 5
5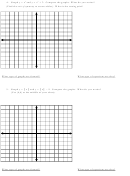 6
6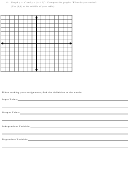 7
7 8
8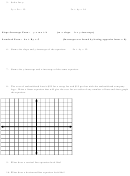 9
9 10
10 11
11 12
12 13
13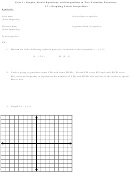 14
14 15
15 16
16 17
17 18
182
2
4. Graph y = x
and y = x
+ 3. Compare the graphs. What do you notice?
(Find the axis of symmetry to create tables). What is the turning point?
What type of graphs are formed?
What type of equations are they?
5. Graph y = │x│ and y = │x│ – 2. Compare the graphs. What do you notice?
(Use (0,0) as the middle of your chart).
What type of graphs are formed?
What type of equations are they?
ADVERTISEMENT
0 votes
Related Articles
Related forms


Related Categories
Parent category: Education