Graphs, Linear Equations, And Inequalities In Two Variables, Functions Worksheet - Mat 100, Armstrong/pierson Page 3
ADVERTISEMENT
 1
1 2
2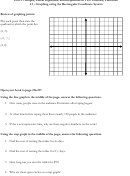 3
3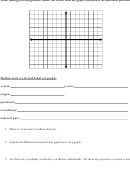 4
4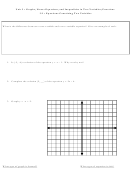 5
5 6
6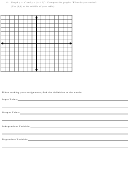 7
7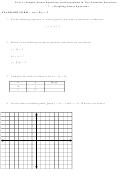 8
8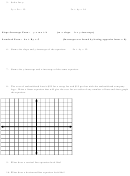 9
9 10
10 11
11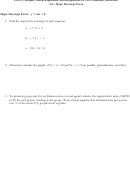 12
12 13
13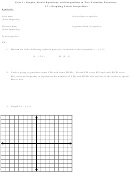 14
14 15
15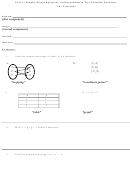 16
16 17
17 18
18Unit 3 – Graphs, Linear Equations, and Inequalities in Two Variables; Functions
3.1 – Graphing using the Rectangular Coordinate System
Review of graphing points:
Plot each point then state the
quadrant in which the point lies.
(4, -5)
-5
(-2,
/
)
2
(4, 0)
Open your book to page 216-217.
Using the line graph in the middle of the page, answer the following questions.
1. How many people were in the audience 80 minutes after taping began?
2. At what time before taping there there exactly 150 people in the audience?
3. If the x-axis represents time, why are there negative numbers on the scale?
Using the step graph in the middle of the page, answer the following questions.
1. Find the cost of renting the trailer for six days.
2. Find the cost of renting the trailer for 2 ½ days.
3. How long can you rent the trailer for $70?
4. Why are there open circles on a step graph?
ADVERTISEMENT
0 votes
Related Articles
Related forms


Related Categories
Parent category: Education