Sta2023 Module 2 Test With Answers Page 3
ADVERTISEMENT
 1
1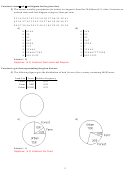 2
2 3
3 4
4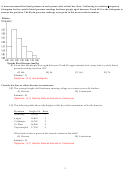 5
5 6
6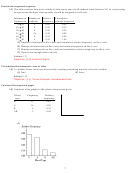 7
7 8
8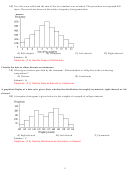 9
9A graphical display of a data set is given. State whether the distribution is (roughly) symmetric, right skewed, or left
skewed.
5) The ages of a group of patients being treated at one hospital for osteoporosis are summarized in the
frequency histogram below.
A) Right skewed
B) Symmetric
C) Left skewed
Answer: C
Objective: (2.4) Classify Distribution as Symmetric or Skewed
Classify the data as either qualitative or quantitative.
6) The following table shows the average weight of offensive linemen for each given football team.
Team
Average weight (pounds)
Gators
303.52
Lakers
326.78
Eagles
290.61
Pioneers 321.96
Lions
297.35
Mustangs 302.49
Rams
345.88
Buffalos
329.24
What kind of data is provided by the information in the second column?
A) Qualitative
B) Quantitative
Answer: B
Objective: (2.1) Classify Data as Qualitative or Quantitative
3
ADVERTISEMENT
0 votes
Related Articles
Related forms


Related Categories
Parent category: Education