Sta2023 Module 2 Test With Answers Page 5
ADVERTISEMENT
 1
1 2
2 3
3 4
4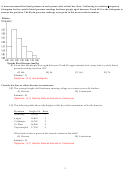 5
5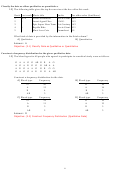 6
6 7
7 8
8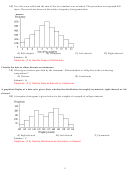 9
9A nurse measured the blood pressure of each person who visited her clinic. Following is a relative-frequency
histogram for the systolic blood pressure readings for those people aged between 25 and 40. Use the histogram to
answer the question. The blood pressure readings were given to the nearest whole number.
9) Given that 600 people were aged between 25 and 40, approximately how many had a systolic blood
pressure reading less than 130?
A) 444
B) 44
C) 144
D) 74
Answer: A
Objective: (2.3) Use Histogram
Classify the data as either discrete or continuous.
10) The average height of all freshmen entering college in a certain year is 68.4 inches.
A) Discrete
B) Continuous
Answer: B
Objective: (2.1) Classify Data as Discrete or Continuous
11) The following table shows the heights of the five tallest mountains in North America.
Mountain
Height (ft)
Rank
McKinley
20,320
1
Logan
19,850
2
Citlaltepec
18,700
3
St. Elias
18,008
4
Popocatepetl
17,930
5
What kind of data is given in the second column of the table?
A) Discrete
B) Continuous
Answer: B
Objective: (2.1) Classify Data as Discrete or Continuous
5
ADVERTISEMENT
0 votes
Related Articles
Related forms


Related Categories
Parent category: Education