Sta2023 Module 2 Test With Answers Page 8
ADVERTISEMENT
 1
1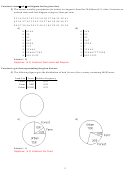 2
2 3
3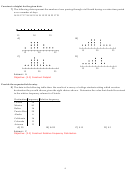 4
4 5
5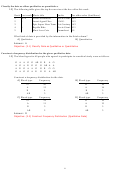 6
6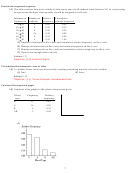 7
7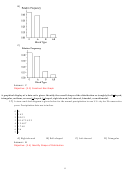 8
8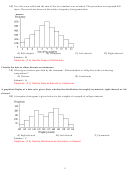 9
9B)
C)
Answer: C
Objective: (2.3) Construct Bar Graph
A graphical display of a data set is given. Identify the overall shape of the distribution as (roughly) bell-shaped,
triangular, uniform, reverse J-shaped, J-shaped, right skewed, left skewed, bimodal, or multimodal.
17) A stem-and-leaf diagram is given below for the annual precipitation in one U.S. city for 28 consecutive
years. Precipitation data are in inches.
0
9
1
1 4 2
2
0 2 0 3
3
0 1 4 7 2 8 3 2
4
1 3 4 8 7
5
1 7 4 8
6
3 6
7
1
A) Right skewed
B) Bell-shaped
C) Left skewed
D) Triangular
Answer: B
Objective: (2.4) Identify Shape of Distribution
8
ADVERTISEMENT
0 votes
Related Articles
Related forms


Related Categories
Parent category: Education