Sta2023 Module 2 Test With Answers Page 4
ADVERTISEMENT
 1
1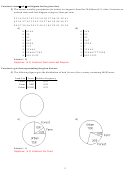 2
2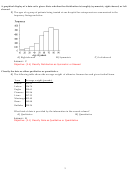 3
3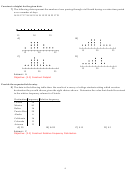 4
4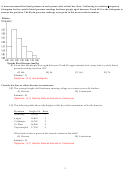 5
5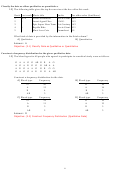 6
6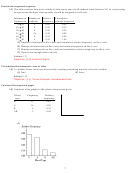 7
7 8
8 9
9Construct a dotplot for the given data.
7) The following data represent the number of cars passing through a toll booth during a certain time period
over a number of days.
18 19 17 17 24 18 21 18 19 15 22 19 23 17 21
15
20
25
A)
B)
15
20
25
15
20
25
C)
D)
15
20
25
15
20
25
Answer: A
Objective: (2.3) Construct Dotplot
Provide the requested table entry.
8) The data in the following table show the results of a survey of college students asking which vacation
destination they would choose given the eight choices shown. Determine the value that should be entered
in the relative frequency column for Florida.
Destination Frequency Relative frequency
Florida
30
Mexico
81
Belize
16
Puerto Rico
29
Alaska
6
California
16
Colorado
11
Arizona
11
A) 30
B) 0.015
C) 0.15
D) 0.3
Answer: C
Objective: (2.2) Construct Relative Frequency Distribution
4
ADVERTISEMENT
0 votes
Related Articles
Related forms


Related Categories
Parent category: Education