Trigonometry Worksheet Page 11
ADVERTISEMENT
 1
1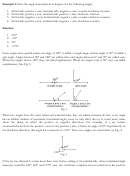 2
2 3
3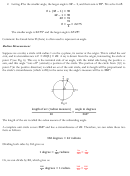 4
4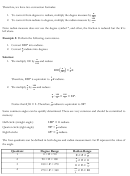 5
5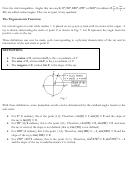 6
6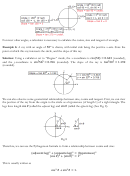 7
7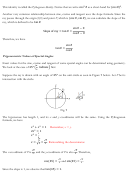 8
8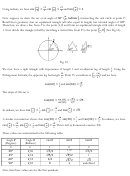 9
9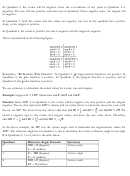 10
10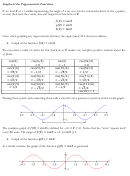 11
11 12
12 13
13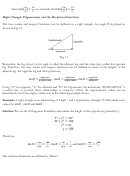 14
14 15
15 16
16 17
17 18
18 19
19 20
20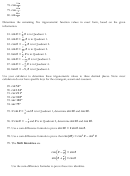 21
21 22
22Graphs of the Trigonometric Functions
If we treat
as a variable representing the angle of a ray as it rotates counterclockwise in the xy-plane,
we may then treat the cosine, sine and tangents as functions of :
{ { = cos
{ { = sin
ℎ { { = tan
Note: when graphing any trigonometric function, the angle (input)
is always in radians.
• Graph of the function { { = cos .
We can create a table of values for this function, as
makes one complete positive rotation about the
xy-plane.
cos { 0 {
cos {
2 {
cos { {
cos { 3
2 {
= 1
= 0
= −1
= 0
cos{
6 {
cos{2
3 {
cos{7
6 {
cos{5
3 {
= −1 2
= 1 2
= 3 2
= − 3 2
cos{
4 {
cos{3
4 {
cos{5
4 {
cos{7
4 {
= 2 2
= − 2 2
= − 2 2
= 2 2
cos {
3 {
cos{5
6 {
cos{4
3 {
cos{11
6 {
= 1 2
= −1 2
= − 3 2
= 3 2
cos{2 { = 1
Plotting these points and connecting them with a smooth curve generates a portion of the cosine graph:
The complete graph of { { = cos is defined for −∞ <
< ∞. Notice that the “wave” repeats itself
every 2 units. The range of { { = cos is −1 ≤ cos ≤ 1.
• Graph of the function { { = sin
In a similar manner, the graph of the function { { = sin is generated
ADVERTISEMENT
0 votes
Related Articles
Related forms


Related Categories
Parent category: Education