Data Display Worksheets - Spectrum Math, Grade 7 Page 4
ADVERTISEMENT
 1
1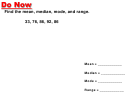 2
2 3
3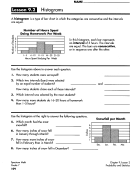 4
4 5
5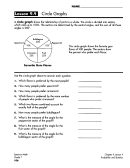 6
6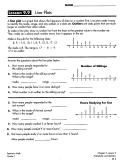 7
7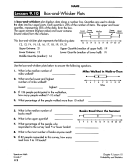 8
8 9
9 10
10NAME ______________________ _
Lesson 9.2
Histograms
A
histogram
is a
type
of bar chart in which the categories are consecutive and the intervals
are equal.
J!!
Number of Hours Spent
Doing Homework Per Week
5i
5
t - - - - - - - - - - - - - - - - 1
]
Lf
t - - - - - - - - - -
0
3
t - - - - - - -
~
2
...0
1-------
E
:I
In this histogram, each bar represents
an
interval
of 5
hours.
The
intervals
are equal. The bars are
consecutive,
or in sequence one after the
other.
z
1-5
6-10
11-15 16
-20
21-25
Hours Spent Studying Per Week
Use the histogram above to answer each question.
I. How many students were surveyed?
2.
Which two intervals (bars) were selected
by an equal number of students?
How many students chose each of those intervals?
3.
Which interval was selected by the most students?
-.. How many more students do
16-20
hours of homework
than
1-
5
hours?
and
Use the histogram at the right to answer the following questions.
S.
Which month had the most
Snowfall per Month
snowfall?
6
t - - - - -
5
t - - - -
6.
How many inches of snow fell
in January through March?
7.
How many more inches of snow
Fell in February than in March?
8.
How many inches of snow fell in December?
Spectrum Math
Grade
7
10"1
"'
~Lf
g
3
....
2
I
Dec.
Jan.
Feb.
Mar.
Chapter
9, lesson 2
Probability
and Statistics
ADVERTISEMENT
0 votes
Related Articles
Related forms


Related Categories
Parent category: Education