Data Display Worksheets - Spectrum Math, Grade 7 Page 8
ADVERTISEMENT
 1
1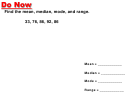 2
2 3
3 4
4 5
5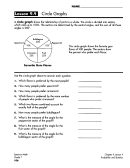 6
6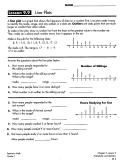 7
7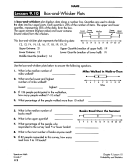 8
8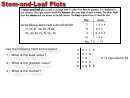 9
9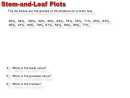 10
10NAME ______________________ _
Lesson 9.10
Box-and-Whisker Plots
A box-and-whisker
plot displays data along a number
line.
Quartiles are used to divide
the data into four equal
parts.
Each quartile is 25% of the number of
items.
The upper and lower
q_uartiles, representing
50%
of the data, form the
box.
The upper extreme (highest value) and lower extreme
Lower
Lower
Median
Upp~r
Upper
(I
I ) fo
h
h k
Extreme Quartile
.L
Quartile Extreme
owest va ue
rm t e w is ers.
•
~
T
J1
•
•
+
+
+
•
This box-and-whisker plot represents the following data:
12, 13, I If, I If, 15, 16, 17,
18, 19,
19,21
12
13
Jlt
15
1
6
17
18
19 20 21
Upper
Extreme:
21
Upper Quartile (median of upper
half}:
19
Lower Extreme: 12
Lower Quartile (median of lower
half):
I If
Middle Quartile
(median):
16
Use the box-and-whisker plots below to answer the following questions.
I.
What is the median number of
miles walked?
Miles Walked in Walk-a-Thon
2.
What are the lowest and highest
numbers of miles walked?
lowest:
highest:
3. If 126 people participated in the walkathon,
how many people walked 7-10 miles?
II. What percentage of the people walked more than I 0 miles?
•
01111
5
+
+
I
I
I
6
7
8
+
•
I
I
I
I
I~
9
10
II
12 13
Miles
5. What is the median number of
Books Read Over the Summer
books read?
6. What is the upper quartile?
7.
What percentage of the people who
responded to the survey read
If
or fewer books?
8. What is the most number of books anyone read?
9.
If 82 people responded to this survey, how many
read from If
to
I 8
books?
Spectrum Math
Grade 7
112
---+
2
lf
6
8
t
10
~
•
12
llf
16 18
20 22
Chapter 9, Lesson I 0
Probability and
Statistics
ADVERTISEMENT
0 votes
Related Articles
Related forms


Related Categories
Parent category: Education