Ap Statistics Worksheets With Answers Page 4
ADVERTISEMENT
 1
1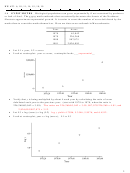 2
2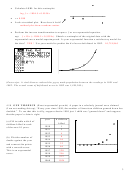 3
3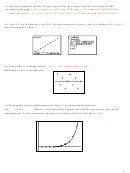 4
4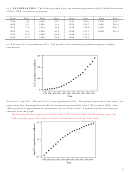 5
5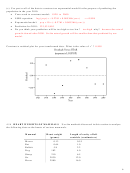 6
6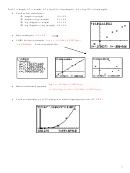 7
7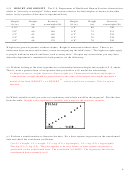 8
8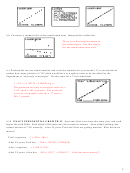 9
9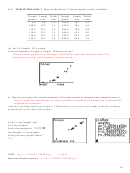 10
10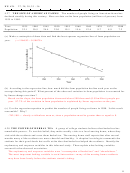 11
11 12
12 13
13 14
14 15
15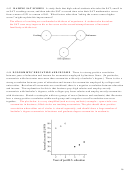 16
16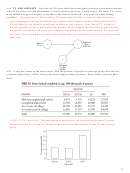 17
17 18
18 19
19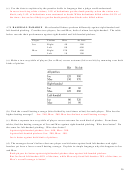 20
20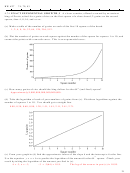 21
21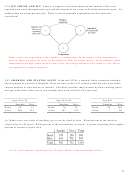 22
22 23
23(c) The paper appeared in 1995, 45 years after 1950. How many children were killed in 1995,
according to the paper?_
If x = number of years after 1950, then y = the number of children killed x
=
=
× 10
13
x
45
years after 1950 = 2
. At x = 45,
y
2
3.52
,
or
35, 200,000, 000, 000 (35
trillion
!)
(d) Let L3 = log (# children) = log (L2). Look at scatterplot of year vs log (# of children) (L1 vs L3)
This should appear linear.
= −
+
ˆ
(e) Find LSRL of scatterplot above.
log
y
587.0085 .30103
x
r =
1
Make sure to look at residual plot.
(f) Perform the inverse transformation to express y ˆ as an exponential equation.
=
∧
ˆ 10
eqt:
y
y
Sketch a scatterplot of the original data with the exponential curve model
1
superimposed. Is your exponential function a satisfactory model for the data?
YES!
4
ADVERTISEMENT
0 votes
Related Articles
Related forms


Related Categories
Parent category: Education