Ap Statistics Worksheets With Answers Page 5
ADVERTISEMENT
 1
1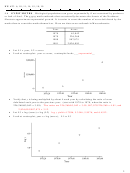 2
2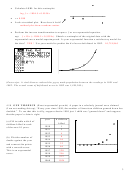 3
3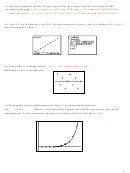 4
4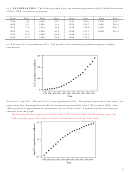 5
5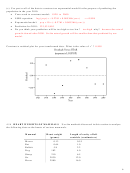 6
6 7
7 8
8 9
9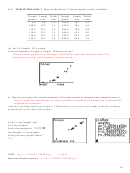 10
10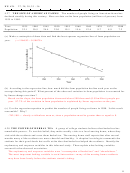 11
11 12
12 13
13 14
14 15
15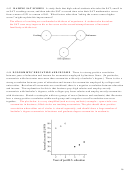 16
16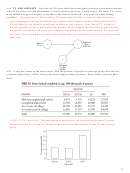 17
17 18
18 19
19 20
20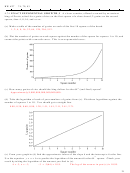 21
21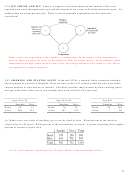 22
22 23
234.11 US POPULATION The following table gives the resident population of the United States from
1790 to 2000, in millions of persons.
Date
Pop.
Date
Pop.
Date
Pop.
Date
Pop.
1790
3.9
1850
23.2
1910
92.0
1970
203.3
1800
5.3
1860
31.4
1920
105.7
1980
226.5
1810
7.2
1870
39.8
1930
122.8
1990
248.7
1820
9.6
1880
50.2
1940
131.7
2000
281.4
1830
12.9
1890
62.9
1950
151.3
1840
17.1
1900
76.0
1960
179.3
(a) Plot year (L1) vs population (L2). The growth of the American population appears roughly
exponential.
(b) Let L3 = log (L2). Plot year (L1) vs log (population) (L3). The pattern of growth is now clear. An
expert says that “the population of the US increased exponentially from 1790 to about 1880. After
1880 growth was approximately exponential, but at a slower rate.” Explain how this description is
obtained from the graph.
The transformed data appear to be linear from 1790 to about 1880, and then linear again, but
with a smaller slope. This reflects a lower exponential growth rate after 1880.
5
ADVERTISEMENT
0 votes
Related Articles
Related forms


Related Categories
Parent category: Education