Graphing The Periodic Trends
ADVERTISEMENT
 1
1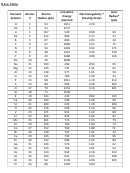 2
2 3
3Graphing the Periodic Trends
Background
The Periodic Table is arranged according to Periodic Law. The Periodic Law states that when elements are arranged in
order of increasing atomic number, their physical and chemical properties show a periodic pattern. These patterns can
be discovered by examining the changes in properties of elements on the Periodic Table. The properties that will be
examined in this lesson are: atomic size, ionic radius, electronegativity, and ionization energy.
Procedure
1. Define the following terms on a separate sheet of paper: period, group (Family), atomic radius, electronegativity,
first ionization energy
2. Graph 1 - For elements 1-36 make a graph of atomic radius as a function of atomic number. Plot atomic number
on the X-axis and the atomic radius on the Y-axis. Use a colored pen or pencil to draw a vertical line that
represents the beginning of each period.
3. Graph 2 - For elements 1-36, make a graph of the ionization energy. Plot atomic number on the X-axis and
ionization energy on the Y-axis. Use a colored pen or pencil to draw a vertical line that represents the beginning
of each period.
4. Graph 3 - For elements 1-36, make a graph of the ionic radius. Plot atomic number on the X-axis and the ionic
size on the Y-axis. Use a colored pen or pencil to draw a vertical line that represents the beginning of each
period.
5. Graph 4 - For elements 1-36, make a graph of the electronegativity. Plot atomic number on the X-axis and the
electronegativity on the Y-axis. Use a colored pen or pencil to draw a vertical line that represents the beginning
of each period.
Computer Directions
1. Turn on computer, log onto the network, start the program Microsoft Excel.
2. Create column headings for the data to be listed. Enter the data from the periodic table into columns. Enter the
data for elements 1-36. If any of the elements are missing data, simply leave them blank-do not enter zero-and
continue down the list.
3. Select the data in the column to be graphed first by clicking on the top cell and dragging down to the bottom of
the cell. Click on the graph (chart) wizard button to produce a graph.
4. Copy the atomic radius numbers from the data table next to (right‐hand side) the atomic numbers in the table
(first column = X variable, second column = Y variable).
5. Highlight both columns (atomic number – atomic radius) and go to Insert on the toolbar and select Chart.
6. You will be given a number of choices. Choose X-Y (scatter), and select the fourth option from the left (Straight
Marked Scatter).
7. A chart should appear. You may need to resize it by dragging the corner. We now need to title and label the axes
of the graph.
8. If the toolbox is not currently open select Toolbox at the top or go to the toolbar and select View and
Formatting Palette.
9. Choose Chart Options on the Formatting Palette.
10. You should see a drop down menu under Titles that you can use to label your graph. Apply the correct labels
with units where appropriate. When finished, print the graph.
11. Repeat this process for the remaining three properties: 1st ionization energy, electron affinity, and
electronegativity.
12. Staple all four graphs to the lab with your completed Analysis Questions.
ADVERTISEMENT
0 votes
Related Articles
Related forms


Related Categories
Parent category: Education