Funcational Assessment Scatterplots Page 5
ADVERTISEMENT
 1
1 2
2 3
3 4
4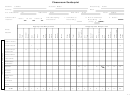 5
5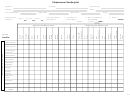 6
6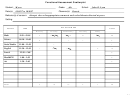 7
7 8
8Classsroom Scatterplot
Student
Teacher Miller
Observer(s)
Charles
Evans
Activity
Date
No. of Students
Start Time
End Time
Total
21
9:10
9:55
45 min.
Observation
Time Sampling
1. Continuous
2. Non-Continuous
3. Other:
10 sec
15 sec
20 sec X
Interval:
Procedure:
Recording:
Recording
X
(every 3
min.):
Appropriate Responses
Inappropriate Responses
Phase
baseline
Paper—Pencil
Listen-Lecture
I
1
2
Teacher-Pupil
II
II
I
II
4
3
7
Discussion
Manipulatives
Inst. Games
Worksheets
Workbook
IlI
II
II
IIll
II
14
14
Readers
Student-
Student
Media/Tech-
Other
Transition
Other
0
2
1
2
0
0
0
0
5
4
2
0
2
7
2
17
22
Total
A-5
ADVERTISEMENT
0 votes
Related Articles
Related forms


 Template")


Related Categories
Parent category: Business