Tables And Charts Page 2
ADVERTISEMENT
 1
1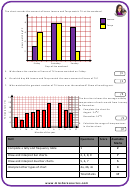 2
2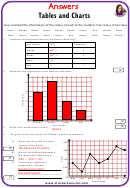 3
3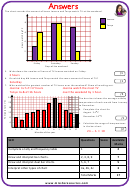 4
4The chart records the amount of hours Joanna and Tanya watch TV at the weekend.
Joanna
8
Tanya
6
4
2
Friday
Saturday
Sunday
Days of the weekend
5. Write down the number of hours of TV Joanna watched on Friday.
/1
6. On which day did Joanna and Tanya watch the same amount of hours of TV?
/1
7. Who watched the greatest number of TV hours over the weekend? Show all working out.
/3
24
The bar chart shows the average midday
temperature of each month from January
20
to December.
16
8. Complete the chart for
��
August 24
��
12
��
December 10
��
8
/1
4
9. Calculate the range of temperatures
in the bar chart.
/2
J
F
M
A
M
J
J
A
S
O
N
D
Months of the year
Skill
Questions
Score
Available
Marks
Complete a tally and frequency table
1
2
Draw and interpret bar charts.
2, 3, 8, 9
7
Draw and interpret dual bar charts.
5, 6, 7
5
Interpret other types of chart
4a, 4b, 4c
3
Total Marks
17
ADVERTISEMENT
0 votes
Related Articles
Related forms

")


")


Related Categories
Parent category: Education