Energy, Frequency, Wavelength And The Electromagnetic Spectrum Page 2
ADVERTISEMENT
 1
1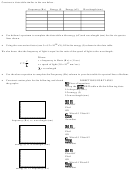 2
2 3
3 4
4Construct a data table similar to the one below.
Frequency (Hz)
Energy (J)
Energy (eV)
Wavelength (nm)
•
Use helium's spectrum to complete the data table with energy (eV) and wavelength (nm) for the six spectra
lines shown.
18
•
Using the conversion factor (one J = 6.2 x 10
eV), fill in the energy (J) column in the data table.
We also know that the frequency of light is equal to the ratio of the speed of light to the wavelength.
Where:
v = frequency in Hertz (Hz) = (1/sec)
c
v =
c = speed of light (3.0 x 10 17 nm/sec)
= wavelength
•
Use the above equation to complete the Frequency (Hz) column in your data table for spectral lines of helium.
•
Construct scatter plots for the following and sketch
DIRECTIONS FOR TI-82/83
the graphs:
Clear all equations
Set up the
EDIT table with the following data:
L1=frequency (Hz)
L2=energy (J)
L3=wavelength (nm)
Plots Off
Plot1
ON
Xlist=L3 Ylist=L1
ZoomStat
frequency (Hz) vs. wavelength (nm)
Plots Off
Plot1
ON
Xlist=L3 Ylist=L2
ZoomStat
energy (J) vs. wavelength (nm)
Plots Off
Plot1
ON
Xlist=L1 Ylist=L2
ZoomStat
energy (J) vs. frequency (Hz)
ADVERTISEMENT
0 votes
Related Articles
Related forms


Related Categories
Parent category: Education