Energy, Frequency, Wavelength And The Electromagnetic Spectrum Page 3
ADVERTISEMENT
 1
1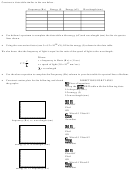 2
2 3
3 4
4Use your graphs to complete the following statements:
Q1. As the frequency increases, the wavelength
.
Q2. As the energy increases, the wavelength
.
Q3. As the frequency increases, the energy
.
In 1905, a German physicist named Max Planck discovered the same relationship for energy and frequencies
as you have plotted in graph number three.
Calculate the line of best fits for the graph of energy (j) vs.
frequency (Hz). Record the regression equation in your lab
Directions for the TI-82/83
notebook and add the regression line to your graph.
•TI-82/83
Linear Regression Equation
CALC LinReg(ax+b) ENTER L1 , L2
ENTER
y=
Q4. What is the value of b for your data?
Q5. Is it correct to assume that (0,0) is a valid origin for this set of data, or should the equation have a some y-
intercept value other than zero? (Be sure to consider what you are graphing) Explain.
Q6. Write a word equation for this graph by substituting into the slope-intercept equation (y=mx+b) the
variable names for x and y, and b=zero.
Q7. Substitute the units for energy and frequency into the word equation and solve for the slope of the line.
What are the units for the slope?
The slope of the line for this graph relates the energy of an electromagnetic wave to its frequency. This value
is called Planck's constant, which is symbolized as "h", just as the speed of light has the symbol "c". Planck's
constant, like pi or the speed of light, never changes. It is a physical constant. The excepted value for Planck’s
constant is 6.63 x 10 -34 J•sec.
Q8. Use the following equation to calculate the percentage error in your calculations of Planck’s constant.
Q9. Use the following symbols to write an equation that makes energy equal to frequency.
h for plank's constant
E for Energy
v for Frequency
Q10. Using what you have learned in this exercise, compile a list of new equations, graphs, conversion factors
and physical constants into your notes.
Findings
F1) Explain why the emission spectrum of a substance is like a fingerprint.
F2) The numbers at the bottom of the spectroscope scale give a wavelength reading for the light emitted in
nanometers (1 x 10 -9 meters). Record the approximate range of wavelengths for the colors of the visible
spectrum.
Color
Red
Orange
Yellow
Green
Blue
Indigo
Violet
Range (nm)
ADVERTISEMENT
0 votes
Related Articles
Related forms


Related Categories
Parent category: Education