Motion Graphs Worksheet
ADVERTISEMENT
 1
1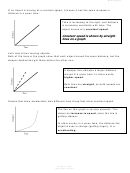 2
2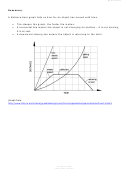 3
3 4
4 5
5 6
6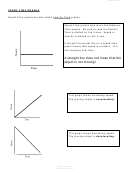 7
7 8
8 9
9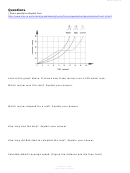 10
10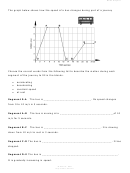 11
11Motion Graphs 1
Name___________________________
Motion Graphs
Describing the motion of an object is occasionally hard to do with words. Sometimes
graphs help make motion easier to picture, and therefore understand.
Remember:
• Motion is a change in position measured by distance and time.
• Speed tells us the rate at which an object moves.
• Velocity tells the speed and direction of a moving object.
• Acceleration tells us the rate speed or direction changes.
DISTANCE-TIME GRAPHS
Plotting distance against time can tell you a lot about motion. Let's look at the axes:
Time is always plotted on the X-axis
(bottom of the graph). The further to
the right on the axis, the longer the
time from the start.
Distance is plotted on the Y-axis (side
of the graph). The higher up the
graph, the further from the start.
If an object is not moving, a horizontal line is shown on a distance-time graph.
Time is increasing to the right, but its
distance does not change. It is not
moving. We say it is At Rest.
M. Poarch – 2003
ADVERTISEMENT
0 votes
Related Articles
Related forms


Related Categories
Parent category: Education