Reading A Bar Graph Worksheet Page 2
ADVERTISEMENT
 1
1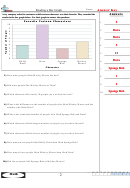 2
2Answer Key
Name:
Reading a Bar Graph
A toy company asked its customers which cartoon character was their favorite. They recorded the
A n s w e r s
results in the bar graph below. Use their graph to answer the questions.
F a v o r i t e C a r t o o n C h a r a c t e r s
5
1.
1 0
9
Dora
2.
8
7
Dora
6
3.
5
4
5
4.
3
2
13
5.
1
0
Dora
D a f f y
D o r a
S p o n g e
M i c k e y
6.
D u c k
B o b
M o u s e
C h a r a c t e r
Sponge Bob
7.
1) How many people liked Mickey Mouse the best?
1
8.
5
9.
2) Did more people like Mickey Mouse or Dora?
Sponge Bob
10.
3) Which character did exactly 10 people say was their favorite?
4) What is the difference in the number of people who liked Mickey Mouse and the
number who liked Dora?
5) What is the combined number of people who liked Sponge Bob and Dora?
6) Which character did the largest number of people say was their favorite?
7) Which character did the fewest number of people say was their favorite?
8) How many more people liked Daffy Duck than liked Sponge Bob?
9) How many fewer people liked Mickey Mouse than liked Dora?
10) Did fewer people like Sponge Bob or Mickey Mouse?
90 80 70 60 50 40 30 20 10 0
1-10
2
Math
ADVERTISEMENT
0 votes
Related Articles
Related forms


Related Categories
Parent category: Education