Tax Rates And Effective Tax Rates Sheet - 2011-2012 Page 16
ADVERTISEMENT
 1
1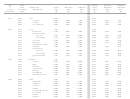 2
2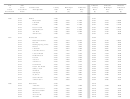 3
3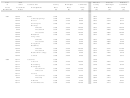 4
4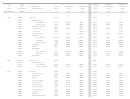 5
5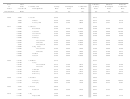 6
6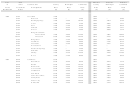 7
7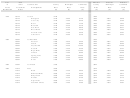 8
8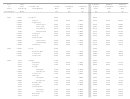 9
9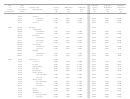 10
10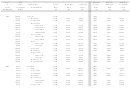 11
11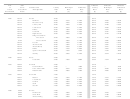 12
12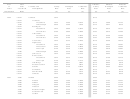 13
13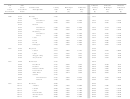 14
14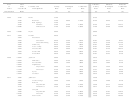 15
15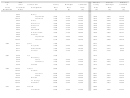 16
16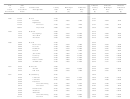 17
17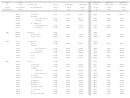 18
18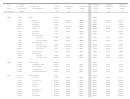 19
19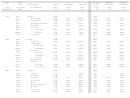 20
20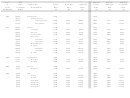 21
21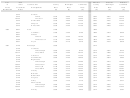 22
22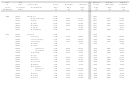 23
23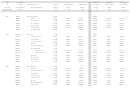 24
24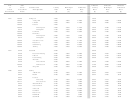 25
25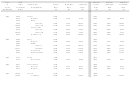 26
26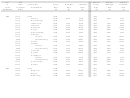 27
27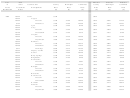 28
28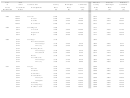 29
29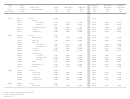 30
30Year
2011
Effective
Effective
Effective
of
Sales
Counties and
County
Municipal
Combined
County
Municipal
Combined
Latest
Assessment
Muncipalities
Rate
Rate
Rate
Rate
Rate
Rate
Revaluation
Ratio
[$]
[$]
[$]
[$]
[$]
[$]
.9869
Kenly:
.9869
In Johnston
.7800
.6100
1.3900
.7698
.6020
1.3718
1.0514
In Wilson
.7300
.6100
1.3400
.7675
.6414
1.4089
.9869
Micro
.7800
.5500
1.3300
.7698
.5428
1.3126
.9869
Pine Level
.7800
.4400
1.2200
.7698
.4342
1.2040
.9869
Princeton
.7800
.5400
1.3200
.7698
.5329
1.3027
.9869
Selma
.7800
.5100
1.2900
.7698
.5033
1.2731
.9869
Smithfield
.7800
.5700
1.3500
.7698
.5625
1.3323
.9869
Wilson's Mills
.7800
.3100
1.0900
.7698
.3059
1.0757
.9869
Zebulon
.9869
In Johnston
.7800
.5000
1.2800
.7698
.4935
1.2632
1.0559
In Wake
.5340
.5000
1.0340
.5639
.5280
1.0918
2006
.8477
Jones
.7400
.6273
.8477
Maysville
.7400
.5400
1.2800
.6273
.4578
1.0851
.8477
Pollocksville
.7400
.3300
1.0700
.6273
.2797
.9070
.8477
Trenton
.7400
.3700
1.1100
.6273
.3136
.9409
2007
.9620
Lee
.7500
.7215
.9620
Broadway:
.9620
In Lee
.7500
.4400
1.1900
.7215
.4233
1.1448
.9762
In Harnett
.7250
.4400
1.1650
.7077
.4295
1.1373
.9620
Sanford
.7500
.5400
1.2900
.7215
.5195
1.2410
2009
1.0296
Lenoir
.8000
.8237
1.0296
Grifton:
1.0296
In Lenoir
.8000
.6000
1.4000
.8237
.6178
1.4414
.9929
In Pitt
.6650
.6000
1.2650
.6603
.5957
1.2560
1.0296
Kinston
.8000
.6600
1.4600
.8237
.6795
1.5032
1.0296
La Grange
.8000
.4500
1.2500
.8237
.4633
1.2870
1.0296
Pink Hill
.8000
.5500
1.3500
.8237
.5663
1.3900
2011
.9867
Lincoln
.5980
.5900
.9867
Lincolnton
.5980
.5600
1.1580
.5900
.5526
1.1426
ADVERTISEMENT
0 votes
Related Articles
Related forms


")


Related Categories
Parent category: Financial