Tax Rates And Effective Tax Rates Sheet - 2011-2012 Page 23
ADVERTISEMENT
 1
1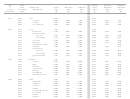 2
2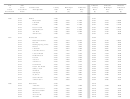 3
3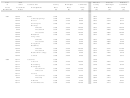 4
4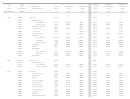 5
5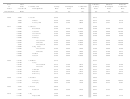 6
6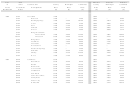 7
7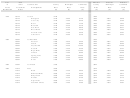 8
8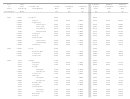 9
9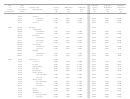 10
10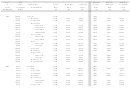 11
11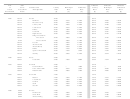 12
12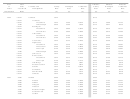 13
13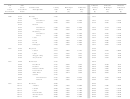 14
14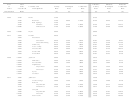 15
15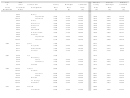 16
16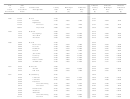 17
17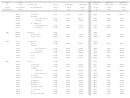 18
18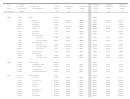 19
19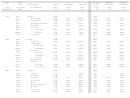 20
20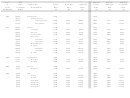 21
21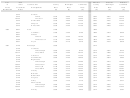 22
22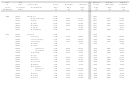 23
23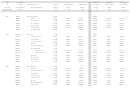 24
24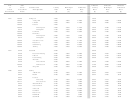 25
25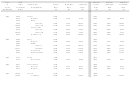 26
26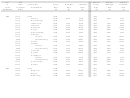 27
27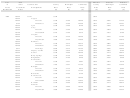 28
28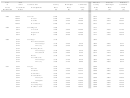 29
29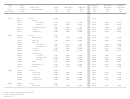 30
30Year
2011
Effective
Effective
Effective
of
Sales
Counties and
County
Municipal
Combined
County
Municipal
Combined
Latest
Assessment
Muncipalities
Rate
Rate
Rate
Rate
Rate
Rate
Revaluation
Ratio
[$]
[$]
[$]
[$]
[$]
[$]
2008
1.0083
Richmond
.8100
.8167
1.0083
Dobbins Heights
.8100
.5000
1.3100
.8167
.5042
1.3209
1.0083
Ellerbe
.8100
.5000
1.3100
.8167
.5042
1.3209
1.0083
Hamlet
.8100
.6600
1.4700
.8167
.6655
1.4822
1.0083
Hoffman
.8100
.2000
1.0100
.8167
.2017
1.0184
1.0083
Norman
.8100
…
.8100
.8167
…
.8167
1.0083
Rockingham
.8100
.4800
1.2900
.8167
.4840
1.3007
2010
1.0000
Robeson
.7700
.7700
1.0000
Fairmont
.7700
.7300
1.5000
.7700
.7300
1.5000
1.0000
Lumber Bridge
.7700
.3000
1.0700
.7700
.3000
1.0700
1.0000
Lumberton
.7700
.6300
1.4000
.7700
.6300
1.4000
1.0000
Marietta
.7700
…
.7700
.7700
…
.7700
1.0000
Maxton:
.7700
1.0000
In Robeson
.7700
.8000
1.5700
.7700
.8000
1.5700
.9998
In Scotland
.9900
.8000
1.7900
.9898
.7998
1.7896
1.0000
McDonald
.7700
.0500
.8200
.7700
.0500
.8200
1.0000
Orrum
.7700
…
.7700
.7700
…
.7700
1.0000
Parkton
.7700
.5000
1.2700
.7700
.5000
1.2700
1.0000
Pembroke
.7700
.6400
1.4100
.7700
.6400
1.4100
1.0000
Proctorville
.7700
.2000
.9700
.7700
.2000
.9700
1.0000
Raynham
.7700
.2000
.9700
.7700
.2000
.9700
1.0000
Red Springs
.7700
1.0000
In Robeson
.7700
.6200
1.3900
.7700
.6200
1.3900
.9269
In Hoke
.7300
.6200
1.3500
.6766
.5747
1.2513
1.0000
Rennert
.7700
.1000
.8700
.7700
.1000
.8700
1.0000
Rowland
.7700
.7600
1.5300
.7700
.7600
1.5300
1.0000
St Pauls
.7700
.6000
1.3700
.7700
.6000
1.3700
ADVERTISEMENT
0 votes
Related Articles
Related forms


")


Related Categories
Parent category: Financial