Draft Final Report Acwa-08-05 - Continuation Of Lower Nushagak River Fecal Coliform And Water Quality Assessment - Alaska Department Of Environmental Conservation - 2008 Page 11
ADVERTISEMENT
 1
1 2
2 3
3 4
4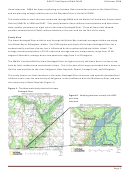 5
5 6
6 7
7 8
8 9
9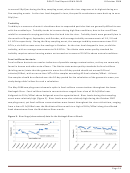 10
10 11
11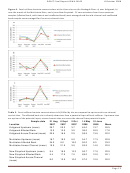 12
12 13
13 14
14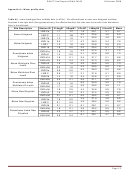 15
15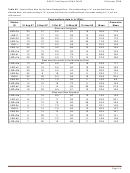 16
16 17
17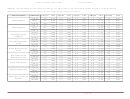 18
18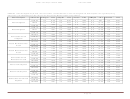 19
19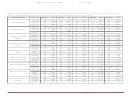 20
20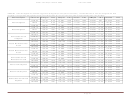 21
21 22
22 23
23DRAFT Final Report ACWA-08-05
8 October 2008
Discussion
Fecal coliform bacteria results showed no pattern with relation to the three suspected sources: the
village of Koliganek, the Mulchatna River, and the village of New Stuyahok. The study design for this
project allowed for comparison of fecal coliform concentrations between both upriver and across
channel control sites and the site just below the suspected input at the affected bank. At each of the
three sites, fecal coliform bacteria concentrations were more abundant at the upriver and cross channel
control sites than the affected bank site on at least three of the five collection dates (Figure 4). At the
Koliganek site, the mean (from the five sampling events) at the affected bank downstream from the
village (LNR-1a) was 17.6 fc/100ml, which was lower than the means from the upstream and across
channel sampling locations at the Koliganek site (Table 2). The affected bank below the Mulchatna
River site (LNR-2a) had a mean of 23.0 fc/100ml, compared to a mean of 22.8 fc/100ml at its upstream
control sites and a mean of 22.0 fc/100ml at its across channel control sites. The affected bank site
below New Stuyahok had a mean of 22.1 fc/100ml, compared to a mean of 22.5 fc/100ml at the
upstream control sites and 20.2 fc/100ml at the across channel control sites. Sites that were located
downstream from the affected bank sites showed similar patterns, with no significant differences
between upstream and downstream sites. A complete list of the fecal coliform data can be found in
Table A2.
When viewing the fecal coliform data in relation to river gage data, the August and September 2007
sampling events occurred when river stage was relatively low (Figure 3). The river stage during the
October 2007 and May and June 2008 sampling events was considerably higher. River stage was
similarly high in both the October 2007 sampling event, when fecal coliform concentrations were at
their lowest, and the May 2008 sampling event when fecal coliform concentrations were at their highest
(on average, almost eight times higher).
Downstream sites were set up across channel to attempt to understand the downriver fate of bacteria.
Since elevated fecal coliform levels were not detected at the three potential sources, an analysis of the
downstream fate of the bacteria is unwarranted. When viewed with the other fecal coliform data, no
meaningful trends emerge.
The data did not suggest that the three possible sources of fecal coliform identified in previous studies
were contributing to the overall fecal coliform bacteria load in the river. Other potential sources of fecal
coliform include wildlife, recreationists, and sport fishers and hunters. During the May 2008 sampling
event when fecal coliform levels were at their highest, dozens of moose and waterfowl were seen by the
sampling crew along the river. During the October 2007 sampling event, when fecal coliform levels were
at their lowest, the sampling crew spotted no wildlife along the river (Appendix B). The May 2008 spike
in fecal coliform concentrations was accompanied by a spike in turbidity (Table A1) and a three-fold
drop in specific conductance (Table A4), suggesting that overland flow during spring break up may have
been contributing to these spikes.
Page 11
ADVERTISEMENT
0 votes
Related Articles
Related forms

 Vt Dec Underground Storage Tank Program Noav Response Form - Department Of Environmental Conservation
Legal
Vt Dec Underground Storage Tank Program Noav Response Form - Department Of Environmental Conservation
Legal
 Non-resident Sporting License Application - New York State Department Of Environmental Conservation
Legal
Non-resident Sporting License Application - New York State Department Of Environmental Conservation
Legal
 Report - Electric, Hydro-electric And Water Power Companies - Pennsylvania Department Of Revenue") Instructions For Rct-112 - Gross Receipts Tax (grt) Report - Electric, Hydro-electric And Water Power Companies - Pennsylvania Department Of Revenue
Financial
Instructions For Rct-112 - Gross Receipts Tax (grt) Report - Electric, Hydro-electric And Water Power Companies - Pennsylvania Department Of Revenue
Financial


Related Categories
Parent category: Legal